Top 5 Kubernetes Dashboards
in Kubernetes
Kubernetes is one of the most essential tools in the cloud native space when dealing with distributed applications. This article includes The Chief I/O selection of the best Kubernetes dashboards.
The management of applications, clusters, and other resources can be sometimes performed using a dashboard.
By definition, a Kubernetes dashboard is a general-purpose web-based user interface used to manage Kubernetes clusters and the applications running on them coupled with an opportunity to troubleshoot where necessary. Also, it can be used to create and modify resources like Deployments and DaemonSets.
Fundamentally, many organizations use the standard Kubernetes dashboard, but in recent years, the community developed additional dashboards. After reviewing some metrics like GitHub stars and the number of forks and considering other criteria like design, look-and-feel, and user-friendliness, we came out with our selection of the top five Kubernetes dashboards.
Kubernetes Dashboard
The Standard Kubernetes Dashboards is the conventional way of managing clusters via a web UI platform. It is recorded to have 9.1k stars and 2.7k forks on GitHub, amongst many other interesting details. In the deployment of containerized applications, the dashboard can help perform the task with a sample wizard. The application details can be specified manually or uploaded as a YAML/JSON file. From the dashboard, one can navigate through clusters, view operational logs, view storage options, and monitor workloads.
Octant
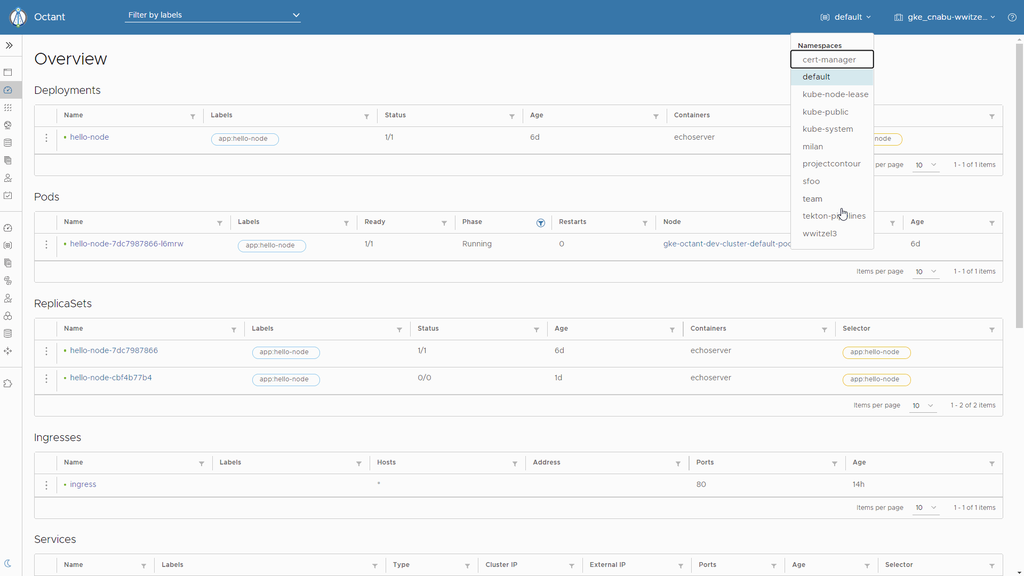
The Octant is a web-based platform that is highly extensible using plugins: developers can make it even more useful by extending it. It is used to better understand the complexity and operations of Kubernetes Clusters. It has an intuitive web-based interface used to navigate, inspect, and manage Kubernetes resources. It is recorded to have 4.8k stars and 331 forks on GitHub. Octant has the major functions of resource and summary viewing, log streaming, label filtering, and clusters navigation. Octant works extensively with the involvement of plugins as they read objects and enable users to add components to the views. Finally, Octant is available for macOS, Windows, and Linux; it also has nightly builds, giving the user access to early releases of new features and plugin APIs.
Weave scope
Weave scope homepage is another web platform used to monitor, visualize, and manage activities on Kubernetes and Docker. The dashboard has 4.8k stars on GitHub and 607 forks. It provides authentic visualization of Kubernetes nodes, pods, containers, memory, CPU usage, and many others. The ability of this dashboard to show how pods communicate is somewhat interesting as the insight is different from others. Also, Weave scope can automatically generate a map of an application, enabling users to monitor and control containerized microservices-based applications.
Konstellate
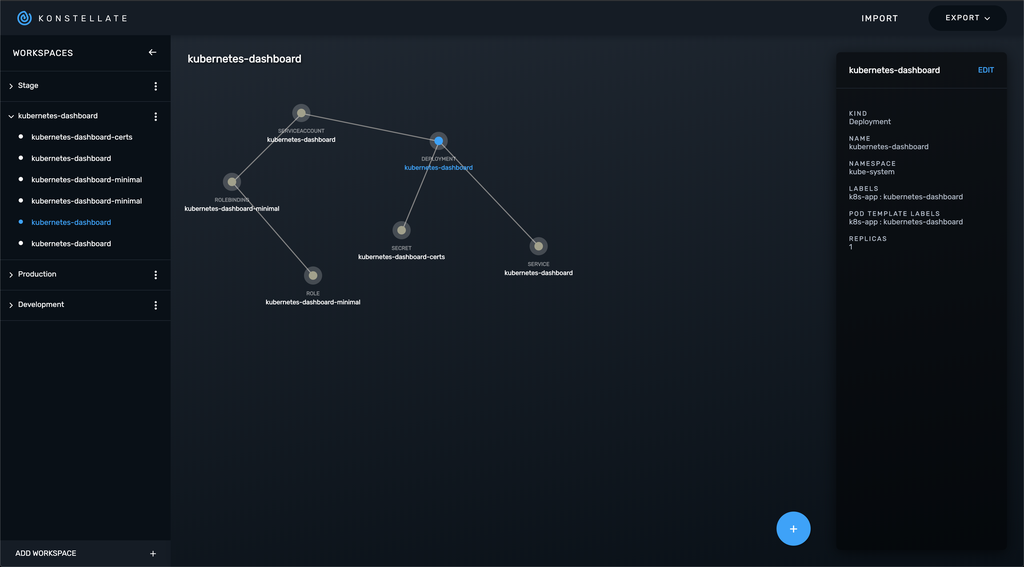
Konstellate is the next top Kubernetes dashboard that can be used in visualizing and managing applications. It is free and open-source. It has 1.4k stars and 71 forks on GitHub. Konstellate can be used to create, edit, and manage diverse resources; however should in case you have to import YAML files, it can be exported as Helm Charts and Kustomize templates.
Resources are easy to create and manage. While the platform evolves, there are future plans to enable GitOps flow, add tree view to the YAML spec, auto-populate required fields in templates, and initialize the ability to package as electron/docker image with local file system synchronization. But in reality, it is a cool application, and the upcoming new features of this tool deserve to be observed.
Kube-Ops-View (KOV)
Multi-cluster management is needed in using Kubernetes to its fullest and Kube-ops view dashboard makes that easy. Kube-Ops View dashboard is a read-only webGL system dashboard used to manage many clusters simultaneously. KOV sees the dashboard as a series of net boxes that show the different resources (cluster, nodes, etc.) as they can be observed, zoomed, and panned as required. It is easy to install and it is the best way of demonstrating how clusters work. On GitHub, it is recorded to have 1.7k stars and 214 forks. Lastly, you could check out the official documentation here.
In conclusion, the dashboards discussed above have been properly studied and drafted out as top 5 based on certain metrics, but in case you need other solutions, there are additional open-source tools out there that could meet your need.
Our dashboard selection is also based on design, look-and-feel, and user-friendliness.
Get similar stories in your inbox weekly, for free
Share this story:
The Chief I/O
The team behind this website. We help IT leaders, decision-makers and IT professionals understand topics like Distributed Computing, AIOps & Cloud Native
Latest stories
Best Cloud Hosting in the USA
This article explores five notable cloud hosting offers in the USA in a detailed way.
Best Dedicated Hosting in the USA
In this article, we explore 5 of the best dedicated hosting providers in the USA: …
The best tools for bare metal automation that people actually use
Bare metal automation turns slow, error-prone server installs into repeatable, API-driven workflows by combining provisioning, …
HIPAA and PCI DSS Hosting for SMBs: How to Choose the Right Provider
HIPAA protects patient data; PCI DSS protects payment data. Many small and mid-sized businesses now …
The Rise of GPUOps: Where Infrastructure Meets Thermodynamics
GPUs used to be a line item. Now they're the heartbeat of modern infrastructure.
Top Bare-Metal Hosting Providers in the USA
In a cloud-first world, certain workloads still require full control over hardware. High-performance computing, latency-sensitive …
Top 8 Cloud GPU Providers for AI and Machine Learning
As AI and machine learning workloads grow in complexity and scale, the need for powerful, …
How ManageEngine Applications Manager Can Help Overcome Challenges In Kubernetes Monitoring
We tested ManageEngine Applications Manager to monitor different Kubernetes clusters. This post shares our review …
AIOps with Site24x7: Maximizing Efficiency at an Affordable Cost
In this post we'll dive deep into integrating AIOps in your business suing Site24x7 to …
A Review of Zoho ManageEngine
Zoho Corp., formerly known as AdventNet Inc., has established itself as a major player in …

