How to Construct a Reliability Model for your Organization

In this post, we’ll construct a basic reliability model and show you how to create one for your own organization.
Originally published on Failure is Inevitable.
As you adopt SRE practices, you’ll find that there are optimization opportunities across every part of your development and operations cycle. SRE breaks down silos and helps learning flow through every stage of the software lifecycle. This forms connections between different teams and roles.
Understanding all the new connections formed by SRE practices can be daunting. Building a model of SRE specific to your organization is a good way to keep a clear picture in your head. A model also acts as a guide for what the supporting communication infrastructure should look like. In this post, we’ll construct a basic reliability model and show you how to create one for your own organization.
Building your reliability model
First, let’s look at the most basic model of your service:
 1
1
Basic indeed! But from the service’s perspective, there isn’t anything else happening. The service is impacted by intended changes (e.g, deploys), or by unintended changes (e.g. incidents). Incidents can be anything that reduces the reliability of the service for users.
Of course, when an incident occurs, you want to restore the service back to its normal reliability. Let’s add incident response to our model:

An incident occurs, which affects the service. The team then kicks off its incident response procedure. This response determines how to correct the incident. The correction can be made either by the respondents themselves, or passed along for development. Seems pretty easy, right? Well, it’s a bit more complicated than that:
Adding incident response to your model
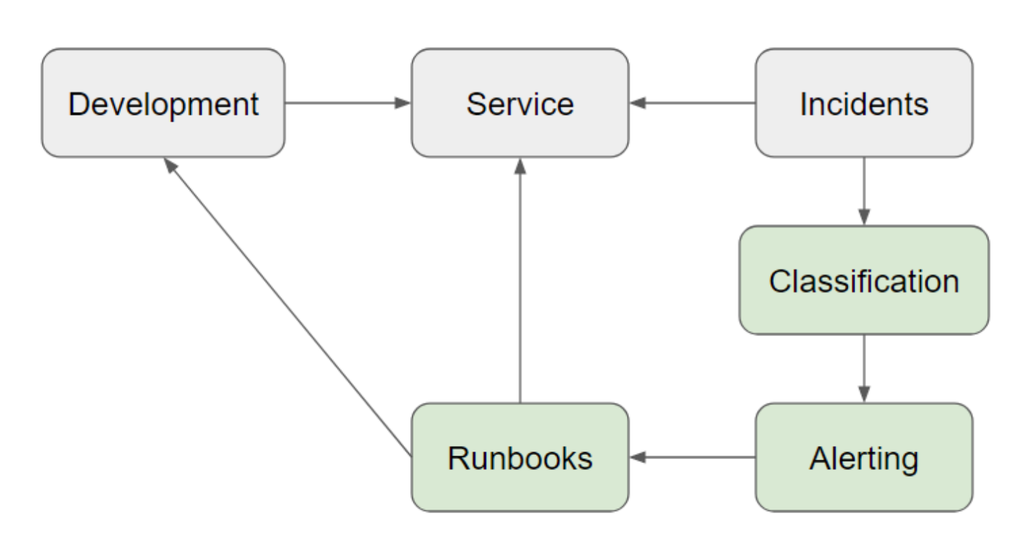
Let’s break down our incident response into three basic steps:
- Classification: the incident is classified based on severity and service area affected, to drive prioritization and accelerate triage.
- Alerting: based on the classification, the on-call team is notified that something is amiss.
- Executing runbooks: to resolve the incident, teams follow a documented procedure.
Depending on the response required, some resolutions can impact the service immediately. Some incidents demand an immediate response, or have solutions that can be implement directly by responders. Others will have a delayed impact as tickets move through development. For example, restarting servers impacts the service. Changing an error in code goes through development.
Modeling to learn from incidents
Let’s add another ingredient that helps you learn from incidents:

The incident retrospective (also known as a postmortem) is a document that summarizes the incident response as well as opportunities for learning. The incident classification, contributing factors, and detailed narrative are all included.
In the above model, arrows running between these practices go both ways. The incident retrospective provides a guide for how to improve your incident response. You’ll use it to review what worked, what didn’t, and why. The retrospective also helps determine how development can resolve incidents with action items. Furthermore, patterns in incidents can help determine development projects that can improve reliability.
Moving from reactive to proactive modeling
Looking for patterns in data to improve reliability is essential to SRE. Where incident response provides reactive approaches for reliability, data provides proactive approaches. Let’s start building the other half of our model to incorporate this notion of proactive learning:
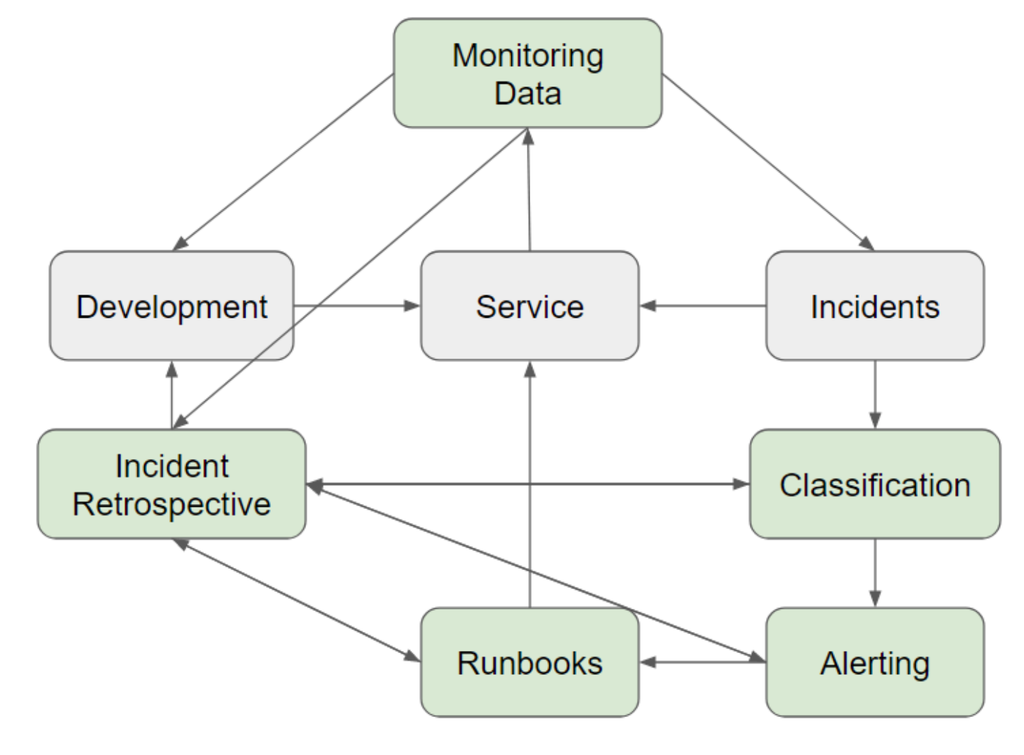
With monitoring tools, you can collect data on how your service is performing. This data can include how fast your service responds, how often it's unavailable, and how accurate its responses are. If the monitoring tool detects a major disruption in these metrics, it can trigger an alert. When compiling the retrospective, monitoring data can provide insightful context. Development teams can also review monitoring data to decide on future projects.
But, raw data alone cannot make these decisions. You have to decide exactly when a disruption is enough to trigger an alert. Setting these thresholds involves another essential SRE tool: service level objectives, as illustrated in the diagram below.

The service level objective or SLO sets the threshold for acceptability of monitoring data. Sometimes this will be a metric based on several monitorable metrics. For example, you could have an SLO set that requires your entire service to be available 99.9% of the time, across each 30-day period. To determine this, monitoring tools would check the availability of several sub-services. The corresponding error budget would provide a rolling graph showing the availability of the service over the last 30 days.
SLOs also have a two-way relationship with development. The inverse of the SLO is the error budget—if a service requires 99.9% uptime, then it also allows 0.1% downtime. If a new development project impacts availability, that impact affects the error budget. The SLO then becomes a tool to understand when to speed up or slow down development based on the remaining error budget.
When the SLO is breached, an incident is triggered. Other incidents also impact the SLO. With our availability example, if an incident caused downtime, it would consume some of the error budget. This allows you to put incidents in a larger context of overall impact on your service.
Our model is almost complete, but there’s one more essential factor:

The set of metrics an SLO monitors is the service level indicator, or SLI. To come up with good SLIs, get into the mind of your customer. One of the most valuable aspects of SRE is transforming customer impact into something measurable and actionable. The customer’s satisfaction is based on the service. The metrics most impactful to their satisfaction become SLIs. Their pain points become the thresholds for the SLO.
Our basic model of reliability is complete. The factors important to customer satisfaction set the thresholds for the service’s reliability. These SLOs help teams make data-driven tradeoffs on how to prioritize planned and unplanned work, to best protect customer experience. When incidents occur, they’re resolved through an incident response system. The incident retrospective transforms the incident into lessons to improve the response system and future development. Our reliability model doesn’t only show how SRE strengthens the reliability of a service. It helps learning flow into development both from customers’ feedback and incidents.
Working with your reliability model
Try building your own reliability model based on this guide. For each step, you can add the specific tools and teams your organization will use. For each arrow, think about how you want to convey information. Some modes of communication include:
- Slack channels
- Slack bots that send alerts
- Reports or other documents
- Virtual meetings
- Email newsletters
- Shared access to a tool
- Collaborative review documents
Having a model is also a great way to see how new tools or processes will integrate into your existing environment. Try adding these new options to your model and see what connections you’ll be able to make. When you add connections, consider what information could help each process. Modeling allows you to streamline as well as explore new ways to share information in your organization.
If you enjoyed this blog post, check these resources out:
- Structuring Your Teams for Software Reliability
- How to Build Your SRE Team
- How SLOs Help Your Team with Service Ownership
Written by: Emily Arnott
Get similar stories in your inbox weekly, for free
Share this story:

Blameless
Blameless is the industry's first end-to-end SRE platform, empowering teams to optimize the reliability of their systems without sacrificing innovation velocity.
Published by
Blameless is the industry's first end-to-end SRE platform, empowering teams to optimize the reliability of their systems without sacrificing innovation velocity.

Latest stories

Best Cloud Hosting in the USA
This article explores five notable cloud hosting offers in the USA in a detailed way.

Best Dedicated Hosting in the USA
In this article, we explore 5 of the best dedicated hosting providers in the USA: …


The best tools for bare metal automation that people actually use
Bare metal automation turns slow, error-prone server installs into repeatable, API-driven workflows by combining provisioning, …

HIPAA and PCI DSS Hosting for SMBs: How to Choose the Right Provider
HIPAA protects patient data; PCI DSS protects payment data. Many small and mid-sized businesses now …

The Rise of GPUOps: Where Infrastructure Meets Thermodynamics
GPUs used to be a line item. Now they're the heartbeat of modern infrastructure.

Top Bare-Metal Hosting Providers in the USA
In a cloud-first world, certain workloads still require full control over hardware. High-performance computing, latency-sensitive …

Top 8 Cloud GPU Providers for AI and Machine Learning
As AI and machine learning workloads grow in complexity and scale, the need for powerful, …

How ManageEngine Applications Manager Can Help Overcome Challenges In Kubernetes Monitoring
We tested ManageEngine Applications Manager to monitor different Kubernetes clusters. This post shares our review …

AIOps with Site24x7: Maximizing Efficiency at an Affordable Cost
In this post we'll dive deep into integrating AIOps in your business suing Site24x7 to …

A Review of Zoho ManageEngine
Zoho Corp., formerly known as AdventNet Inc., has established itself as a major player in …
