How to Watch Kubernetes Events

The lack of a built-in observability tool is one significant downside of Kubernetes. Log and events metrics are essential in debugging and maintaining the Kubernetes environment.
This problem needs to be solved using a third-party tool, and we’ve highlighted some of the best free open source tools to watch Kubernetes events in this blog.
Kubernetes is an open source framework built on loose web components that allows it to be platform-generic and highly extensible. Kubernetes helps developers to have full control of the containerization and automation process.
This flexibility, however, also comes with a downside. While there are a couple of challenges encountered from using Kubernetes, one of the common challenges is observability.
Kubernetes events show what is happening in a cluster when there is a state change or error from other resources in the system. It offers you information regarding changes, such as why the system cannot pull the docker image or why some pods were evicted from the cluster.
Events are resource types created automatically by all core components and extensions in a cluster through the API Server.
Accessing Kubernetes Events
Kubernetes does not have built-in support to access, store or forward events over a long time. It retains it for a short time and is cleaned afterward.
Kubernetes events logs can be accessed directly from the cluster using Kubectl and collected or watched through a logging tool.
Running the kubectl describe command on specific cluster resources will list the events for that resource. A more generic way of doing this is by running the kubectl get events command, which lists the specific resources' events or the entire cluster.
To collect or watch the events, you can run kubectl get events --watch in deployment and collect the output with a third-party logging tool.
To watch Kubernetes events, many free and paid third-party tools help provide visibility and reporting of events in a Kubernetes cluster resource.
Let’s take a look at some of the free open source tools and how you can use them to watch your Kubernetes environment.
Kubewatch
Kubewatch is a Kubernetes event watching tool that tracks every resource changes in a cluster and notifies them through a preset channel/webhooks. Kubewatch is an open source Kubernetes watcher written in Golang that provides monitoring solutions and easy reporting to popular collaboration channels.
Kubewatch supports notification publishing to channels including Slack, Hipchat, Webhook, Flock, Mattermost, and SMTP.
How to Install Kubewatch
Kubewatch provides simple commands to easily configure and install the tool in your Kubernetes environment through kubectl and helm.
Using Kubectl
To easily install Kubewatch using kubectl, you need to create a ConfigMap.yml file to hold the kubewatch configuration.
In order to reach the API server, a kubewatch container will be created along with the kubectl sidecar container.
To create Kubernetes configmap, run:
$ kubectl create -f kubewatch-configmap.yaml
Then create the pod directly, or create your own deployment using:
$ kubectl create -f kubewatch.yaml
Once the Pod is up and running, your Kubernetes event notifications will start showing in your configured notification channel.
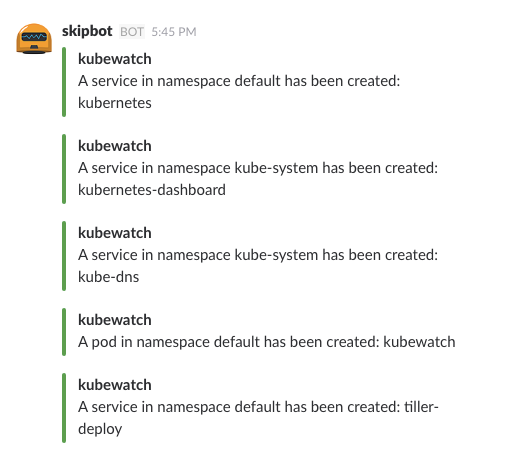
Below is an example of Kubernetes event notification on Slack using Kubewatch.
Using helm
Make sure you have helm installed in your cluster then you can configure Kubewatch using the following command:
helm install --name
kubewatch bitnami/kubewatch --set='rbac.create=true,slack.channel=#YOUR_CHANNEL,slack.token=xoxb-YOUR_TOKEN,resourcesToWatch.pod=true,resourcesToWatch.daemonset=true'
You can also create provide the configuration values in a .yml and use
$ helm upgrade --install kubewatch bitnami/kubewatch --values=values-file.yml
Kubewatch also has other easy commands that allow you to customize your event notifications and other necessary settings. Refer to the reference section.
Eventrouter
Eventrouter is a simple, easy-to-use Kubernetes tool that watches a resource's events in a cluster and pushes the notification to a sink.
It leverages the sink to make Kubernetes events available for a long time to allow debugging and long-term system analysis.
How to Run Eventrouter
Event use provides a simple command to install, delete and inspect deployment events using kubectl.
To run Evntrouter in your cluster use:
$ kubectl create -f https://raw.githubusercontent.com/heptiolabs/eventrouter/master/yaml/eventrouter.yaml
To delete Eventroute use:
$ kubectl delete -f https://raw.githubusercontent.com/heptiolabs/eventrouter/master/yaml/eventrouter.yaml
To inspect the Eventrouter output use:
$ kubectl logs -f deployment/eventrouter -n kube-system
Events Exporter
Events exporter is an open-source tool that lists and watches Kubernetes events. It watches Kubernetes event occurrence, determines how long the event lasts and reports the metrics.
The metrics can be queried based on event counts and unique event counts in the last hour.
How to Run Event Exporter
Event exporter provides various commands to deploy, build, run and check the metrics.
To build the event explorer run:
$ VERSION=v1.0.0 REGISTRY=docker.io make build
You can run the tool both inside Kubernetes (using the Kubernetes service account) and outside Kubernetes (by searching for the kubeconfig file in /.kube path).
To run inside Kubernetes:
$ ./event_exporter
To run outside Kubernetes:
$ ./event_exporter --kubeConfigPath=$HOME/.kube/config
To check the tool metrics:
curl http://<pod-ip>:9102/metrics
Events exporter also allows you to deploy it directly in your Kubernetes cluster by using the image:
caicloud/event-exporter:${VERSION}
Refer to the reference section for full usage and command of Events Exporter.
Sloop
Sloop is an independent solution that monitors, stores, and visualizes events and changes in Kubernetes resources over time. It is designed to provide a timeline of updates made to existing resources and resources that no longer exist in the cluster.
The visual dashboard also allows for easy inspection of event metrics for debugging and error handling purposes.
How to Run Sloop
To install Sloop, you can use helm chart, docker, or build it from the source.
To build Sloop from source, you need to clone the sloop Github repository and build it using a make file:
mkdir -p $GOPATH/src/github.com/salesforce
cd $GOPATH/src/github.com/salesforce
git clone <https://github.com/salesforce/sloop.git>
cd sloop
make
$GOPATH/bin/sloop
When complete, Sloop should be running at http://localhost:8080/
Refer to the reference section for full usage of Sloop.
Get similar stories in your inbox weekly, for free
Share this story:

The Chief I/O
The team behind this website. We help IT leaders, decision-makers and IT professionals understand topics like Distributed Computing, AIOps & Cloud Native
Latest stories
Best Cloud Hosting in the USA
This article explores five notable cloud hosting offers in the USA in a detailed way.
Best Dedicated Hosting in the USA
In this article, we explore 5 of the best dedicated hosting providers in the USA: …
The best tools for bare metal automation that people actually use
Bare metal automation turns slow, error-prone server installs into repeatable, API-driven workflows by combining provisioning, …
HIPAA and PCI DSS Hosting for SMBs: How to Choose the Right Provider
HIPAA protects patient data; PCI DSS protects payment data. Many small and mid-sized businesses now …
The Rise of GPUOps: Where Infrastructure Meets Thermodynamics
GPUs used to be a line item. Now they're the heartbeat of modern infrastructure.
Top Bare-Metal Hosting Providers in the USA
In a cloud-first world, certain workloads still require full control over hardware. High-performance computing, latency-sensitive …
Top 8 Cloud GPU Providers for AI and Machine Learning
As AI and machine learning workloads grow in complexity and scale, the need for powerful, …
How ManageEngine Applications Manager Can Help Overcome Challenges In Kubernetes Monitoring
We tested ManageEngine Applications Manager to monitor different Kubernetes clusters. This post shares our review …
AIOps with Site24x7: Maximizing Efficiency at an Affordable Cost
In this post we'll dive deep into integrating AIOps in your business suing Site24x7 to …
A Review of Zoho ManageEngine
Zoho Corp., formerly known as AdventNet Inc., has established itself as a major player in …
