Alternatives to Datadog
Before we dive into the specifics of each alternative to Datadog, let's address the most critical point: scaling. Datadog is great for users who need to do a little bit of everything, but Datadog's biggest weakness is scaling.
Before we dive into the specifics of each alternative to Datadog, let's address the most critical point: scaling. Datadog is great for users who need to do a little bit of everything, but Datadog's biggest weakness is scaling.
Datadog can do logs, APM, time-series and more, but scaling time-series metrics, alerts, and servers will cause your monthly bill to escalate. The graph below shows what you pay at Datadog vs. MetricFire, a leading competitor:

MetricFire is a time-series metrics monitoring platform, built on the open source Graphite, Prometheus and Grafana. MetricFire specializes in scaling custom-series metrics, where as Datadog doesn't. MetricFire balances the cost, functionality, and ease-of-use that today's DevOps engineers are looking for. To find out more, you should book a demo with the MetricFire team!
MetricFire
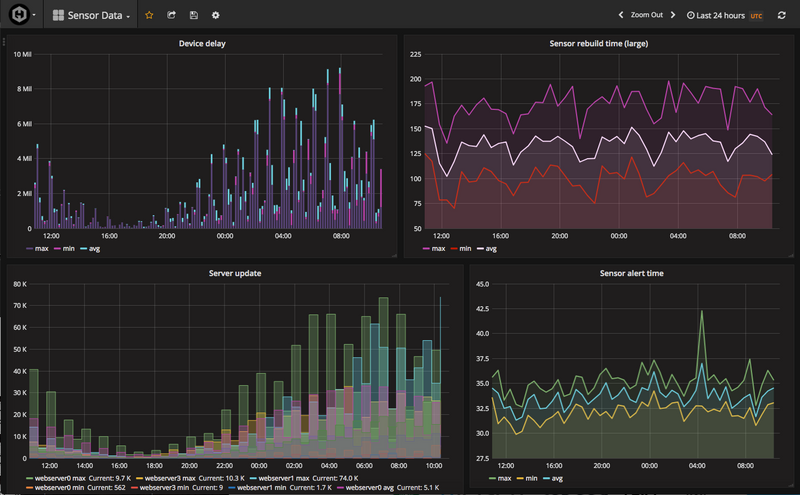
MetricFire is an enterprise-focused monitoring solution providing its users end-to-end infrastructure monitoring built on three primary open-source services: Grafana, Graphite, and Prometheus. MetricFire has made technical improvements upon these open-source systems, as well as made all three open-source projects available as one hosted product. MetricFire is designed for teams of every size, from startups to large scale enterprises.
With Hosted Graphite on MetricFire, redundant storage is available up to 3 times. With Hosted Graphite running on Riak, essentially replacing Graphite’s antiquated file-based whisper storage, one can seamlessly scale with a cluster-based database. MetricFire additionally provides increased support for tagged metrics, automatic backup and 24/7 support from engineers.
Hosted Prometheus on the other hand, bundles 3x redundancy for all user data in the backend for high fault-tolerance with downsized samples support for 5 minutes and 1 hour. Business-ready Prometheus as a service by MetricFire packs end-to-end Hosted Prometheus and data visualization with Grafana, starting at 99 USD a month. MetricFire helps get your business set up quick - you can get your own Prometheus infrastructure monitoring solution up and running today with MetricFire's free trial.
Grafana as a service is a highly intuitive user interface that is included in all of MetricFire's standard pricing plans. You should book a demo with MetricFire!
Datadog
Datadog is a Software as a Service (SaaS) infrastructure & application monitoring tool. Datadog is used mostly in environments with a need to monitor a diverse range of tools and services over the cloud - from network to system to server monitoring. Datadog covers it all with its 200+ integrations for tools and services, making it easier to monitor every component of the tech stack.
Datadog started in 2010, as a cloud infrastructure monitoring service, with dashboards, alerting, and visualizations of metrics. As cloud adoption increased, Datadog grew rapidly and expanded its product offering to cover service providers including Amazon Web Services (AWS), Microsoft Azure, Google Cloud Platform, Red Hat OpenShift, and OpenStack. Datadog quite recently launched its application monitoring service as well.
Datadog, with its customizable dashboards, is free for up to 5 hosts (with 1-day data retention). After that, customers are billed at $15/host per month. There’s also a 14-day free trial available. You can check the updated pricing of the Datadog infrastructure on the website. The UI can be a bit murky at times, with a steep learning curve as it takes some time to get used to it. It is possible to integrate with apps such as PagerDuty or slack to receive notifications. As well, scaling time series metrics can be very expensive at Datadog.

New Relic
New Relic comes in as a strong alternative to Datadog by providing infrastructure monitoring that records metrics, and it watches out for events that affect the servers in near real-time. It also provides pre-configured dashboards for 50 or more services including Amazon Web Services, Microsoft Azure, Google Cloud Platform and their integrations.
Monitoring capabilities for Kubernetes provides customers with the ability to troubleshoot, access, and analyze metrics across both application-related and infrastructure-related use cases. It also has the ability to create dynamic alerting, build custom integrations through New Relic’s integrations SDK, and configure management tools. New Relic is surely a strong contender to DataDog. However, New Relic’s integrations aren’t easy for everyone to set up and requires some level of technical understanding. On the documentation and UI front, New Relic can do much better.
To compare pricing, at first New Relic provides a 30-day free trial. Then the essentials pack goes for $7.20 per user per month, and the pro pack goes for $14.40 per user per month. You can learn more about what’s included by checking the pricing page here.

Prometheus
Prometheus is an open-source monitoring system that is built around providing an end-to-end monitoring solution for its own time-series database. It’s part of the Cloud Native Foundation and it's well supported by the community. It’s able to receive data and store it, in addition to supporting queries, graphs, and in-built alerting. It comes with a push gateway for exporting metrics from ephemeral or batch jobs, and comes with a range of exporters. The Prometheus query language (PromQL) can be used to explore metrics and draw simple graphs with a lot of complexity.
Prometheus is built for both system monitoring as well as dynamic service-oriented architectures. Its design is focused on reliability, multi-dimensional data collection, and visualizations through Grafana dashboards. While being open-source and free, Prometheus can be quite technical, not to mention time-intensive to set up, configure and deploy in enterprise environments. Open-source Prometheus metrics have a default retention period of 15 days, which can be increased with the amount of storage you assign to it. Data can be stored for up to 2 years with Hosted Prometheus offered by MetricFire.

AWS CloudWatch
AWS CloudWatch is a suite of tools that encompasses a wide range of cloud resources, including collecting logs and metrics, monitoring, visualization, alerting, and automated action in response to operational health changes. The resources can be on AWS, on-premises or a combination of both. CloudWatch is an excellent tool because it allows you to go beyond monitoring into observability.
In the case where you have an application running and it's using EC2, SNS, and AWS Lambda - CloudWatch can take care of both the application performance data and the infrastructure monitoring information that goes with it. Also, it simultaneously displays both on the same dashboard. CloudWatch collects the metrics, monitors instances, alerts (Alarms and Events functions) and analyzes the overall system. CloudWatch charges on a pay-per-metric basis, where the cost for processing large amounts of metrics can grow substantially higher than competing monitoring solutions.
While it can’t be customized like other open-source alternatives, it’s the best tool for monitoring other services in the Amazon Web Services. However, there is no Dashboard customization available. AWS also doesn’t automatically provide storage metrics. CloudWatch needs to improve integrations with a broader range of services to become a more widely applicable infrastructure monitoring tool.
Graphite
Graphite is designed to be a time-series monitoring and graphing tool. It was a truly groundbreaking tool when it was released back in 2006. Graphite was way ahead of its time in the monitoring space, boasting best performance whether it was with cheap hardware or Cloud infrastructure. More than a decade later, the community is loyal to its stability and performance.
According to Graphite documentation, Graphite stores numeric time-series data and renders graphs of this data on demand. According to its architecture, Graphite doesn’t collect any metrics on its own, rather it offers a simpler path for getting your measurements into a time-series DB. You can use several already available metric collectors like StatsD. You can see more about how to implement StatsD with Graphite in the StatsD configuration article.
Graphite has been getting mixed reviews over the last few years because it has issues when running at scale and in clustered environments. The Carbon daemon is not always able to perform optimally due to its native code written in Python, and it doesn't have the best UI. However, these issues are sorted out by MetricFire's Hosted Graphite. MetricFire's Hosted Graphite improves upon open-source Graphite in other ways too, such as adding team accounts, a metrics collector agent, granular dashboard permissions, and further integrations.
If you want an open-source metrics and visualization tool that has features that are on par with many enterprise tools, Graphite is worth giving a shot. It might not be exactly what you are looking for, but with a little trial and error, you can build a completely customized Graphite (or Graphite-like) deployment that works great for your environment.

Dynatrace
Dynatrace’s cloud infrastructure entities serve its users with ML-powered solutions spanning native as well as hybrid environments, with continuous auto-discovery of host machines, containers, events, and logs. Dynatrace also permits its users to analyze key infrastructure health metrics in real-time. With AI-Ops, one can deduce precise and immediate answers about anomalies and data points of possible concern. Dynatrace enterprise can be set up on bare metal, VMware, OpenStack, AWS, Azure, or as hybrid solutions.
Dynatrace went public in August 2019. From then APM, AIOps, cloud infrastructure monitoring, and more. Dynatrace has transaction tracing, synthetic monitoring, real user monitoring, and network monitoring. The software manages the availability and performance of software applications as well as the impact on overall user experience. The free version allows up to 5 servers to be monitored for an unlimited time, however it excludes data retention. The number of visits on the free version is capped at 100k.
While there is no mention of pricing on the Dynatrace website, the free version is good for small and immediate deployment infrastructures. The interface seemed a bit too cluttered, especially for users with no experience with cloud monitoring tools. Otherwise all and all a solid alternative to Datadog.

Conclusion
There are many extremely competitive tools available in the market of infrastructure monitoring. Hopefully this post provides you with the right insight, knowledge, and advice before choosing the right tool for you.
If you're ready to start monitoring now, try out MetricFire's free trial. Also, book a demo and talk to us directly about your monitoring needs.
Get similar stories in your inbox weekly, for free
Share this story:

MetricFire
MetricFire provides a complete infrastructure and application monitoring platform from a suite of open source monitoring tools. Depending on your setup, choose Hosted Prometheus or Graphite and view your metrics on beautiful Grafana dashboards in real-time.
Published by
MetricFire provides a complete infrastructure and application monitoring platform from a suite of open source monitoring tools. Depending on your setup, choose Hosted Prometheus or Graphite and view your metrics on beautiful Grafana dashboards in real-time.

Latest stories

Best Cloud Hosting in the USA
This article explores five notable cloud hosting offers in the USA in a detailed way.

Best Dedicated Hosting in the USA
In this article, we explore 5 of the best dedicated hosting providers in the USA: …


The best tools for bare metal automation that people actually use
Bare metal automation turns slow, error-prone server installs into repeatable, API-driven workflows by combining provisioning, …

HIPAA and PCI DSS Hosting for SMBs: How to Choose the Right Provider
HIPAA protects patient data; PCI DSS protects payment data. Many small and mid-sized businesses now …

The Rise of GPUOps: Where Infrastructure Meets Thermodynamics
GPUs used to be a line item. Now they're the heartbeat of modern infrastructure.

Top Bare-Metal Hosting Providers in the USA
In a cloud-first world, certain workloads still require full control over hardware. High-performance computing, latency-sensitive …

Top 8 Cloud GPU Providers for AI and Machine Learning
As AI and machine learning workloads grow in complexity and scale, the need for powerful, …

How ManageEngine Applications Manager Can Help Overcome Challenges In Kubernetes Monitoring
We tested ManageEngine Applications Manager to monitor different Kubernetes clusters. This post shares our review …

AIOps with Site24x7: Maximizing Efficiency at an Affordable Cost
In this post we'll dive deep into integrating AIOps in your business suing Site24x7 to …

A Review of Zoho ManageEngine
Zoho Corp., formerly known as AdventNet Inc., has established itself as a major player in …
