Collectd vs. StatsD

Various systems generate metrics and logs. For example, CPU, swap, network usage and many other metrics from different software such as DBMS, virtual machines, services, cloud, etc.
Introduction
Various systems generate metrics and logs. For example, CPU, swap, network usage and many other metrics from different software such as DBMS, virtual machines, services, cloud, etc. One of the best ways to monitor time-series data is with the open source app, Graphite. Graphite is a comprehensive tool that can analyze, visualize and store metrics in real time.
If you're interested in trying out Graphite, there's a Hosted Graphite service that you can use free by going on to MetricFire's 14-day free trial. We recommend checking it out here, as it removes the hassle of setting it up yourself.
In order to pipe data into Hosted Graphite, we need a daemon to collect the data for us. That daemon is usually either collectD or StatsD. Each daemon has a slightly different function and use case. This article will address which situations each daemon applies to.
First, let's take a look at how collectd and StatsD interact with Graphite. Graphite is a complex product that stores time series and visualizes them in their web app. Take a look at Graphite's architecture below:
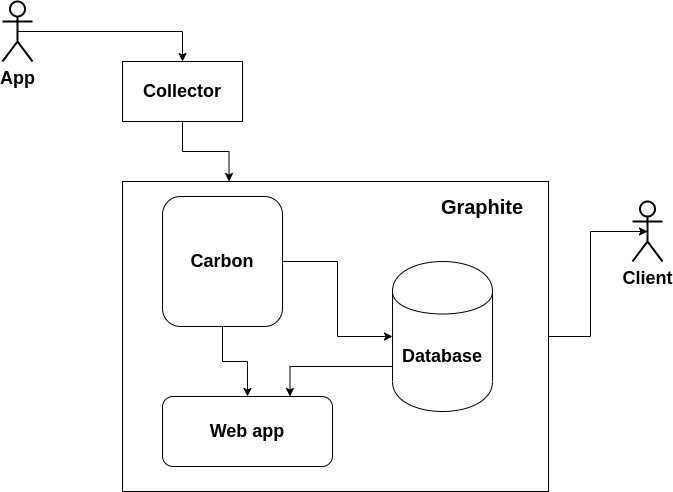
Your app (service, daemon, etc.) generates some metrics and sends them to a collector. The role of the collector is played by collectd or StatsD. To find out more about how Graphite works generally speaking, check out our articles on Graphite's architecture and concepts, and Graphite's installation and setup. In this article we'll focus mostly on the collector.
The collector aggregates these metrics and sends them in specified periods of time with some additional meta to Carbon. Carbon is just 3 daemons, and the simplest config can use just carbon-cache for saving data. Two others are carbon-relay (can be used for sharding) and carbon-aggregator (can aggregate some data). We can also skip the Collector and send data directly to Carbon, but here you can get the following issue: if you get 2 metrics with the same name and timestamp - Graphite will save only the last one. That is a big problem because creating new instances of the app (or service) is a very popular way of scaling.
Therefore, we need a Collector that will aggregate the data for us before the data reaches Carbon, so that we don't get this duplicate time-stamp issue. We have two options: StatsD and collectd. Let's take a look at each below.
What is StatsD?
StatsD is one of the Collectors we are talking about. It is used for getting accurate data aggregation. It's written on Node.js. All you need to do is:
- download all deb packages
- configure daemon (/etc/statsd/localConfig.js)
- write an aggregation config (/etc/carbon/storage-aggregation.conf)
- write a storage config (/etc/carbon/storage-schemas.conf).
After that, StatsD will send data every 10 seconds (by default) to Graphite. To perform this, the daemon combines all the data it has collected over a given time and creates separate points for each metric, which it then passes to Graphite. If you decide to configure Graphite and StatsD so that the values are written at intervals other than the default 10 seconds, make sure that Graphite and StatsD are synchronized. That is, StatsD needs to be configured so that it writes metrics at the same frequency with which Graphite saves them.
StatsD provides many libraries written in different programming languages, which makes it very easy to set up data tracking for any application. For example, python-statsd from pip will help you to write a client that will send data to a StatsD collector. You can also write your own client in any language that can send UDP or TCP requests. StatsD can be set up in a master machine with a single instance.
Looks not so easy? Try the Hosted StatsD.
When to use collectd?
StatsD is good when you are developing the app by yourself or when the application already supports StatsD. But what if you want to send metrics for CPU, network or memory usage? Also, how would you track metrics for PostgreSQL or NGinx?
In these cases, collectd is what we need. It implements ready to use metrics from a wide variety of plugins. Just define plugins you need (e.g. CPU, load, processes, df, disk, network, memory, rrdtool, apache, Nginx, MySQL, PostgreSQL, bind, java, Memcached, etc.) and configure them (/etc/collectd/collectd.conf).
Then, configure the last plugin that will send all this info directly to Graphite. Collectd should be installed on every machine that is being monitored or contains a monitored application.
How to choose the right solution
Collectd is a data collection software with plugin architecture. Common plugins include CPU, Memory, Disk Usage, Processes, Network Traffic, Apache metrics, etc. For now, we have a plugin StatsD for CollectD that will also collect metrics from StatsD. CollectD can make simple aggregations with the Aggregation plugin as well. CollectD should be installed at each machine where you need to collect the metrics. Then, the data can be sent to Graphite with another plugin. Collectd can be used for infrastructure and application monitoring where there is no need to implement any special logic for collecting metrics.
StatsD is used more for application monitoring. You can send custom metrics based on set intervals. The common metrics include gauges, counts, sets, and intervals. Gauges take the last of these measurements within an interval and report it. Counts aggregate data over a 10-second period (can be configured). Sets return a unique count of values encountered. Intervals are time-based calculations (like rates). Here, we should have a central deployed StatsD (which will accept the input from different sources) and multiple clients for each machine that will send metrics to a central StatsD Collector.
The Hosted Graphite Agent
If you use Hosted Graphite, the developers wrote an agent specifically for the app's users, that allows them to by-pass both StatsD and collectd. This agent can push metrics into the app with a really simple installation.
You will get:
- Faster submission of metric data from your application because it doesn't have to do a DNS lookup, or connect out across the internet.
- More reliable delivery because of the agent stores-and-forwards, buffering on disk when it can't connect.
- Easier debugging for the œmy metric is missing problem because the Hosted Graphite UI can tell you that an agent has stopped responding.
- More secure: the agent uses HTTPS and while Hosted Graphite offers TLS-wrapped carbon protocols, it's more effort to use than the plaintext ones. Sending straight to the agent bypasses this and we take care of it for you.
- No need to prefix your metrics with an API key for HG's authentication: it's handled for you, using API key in the agent config.
- No need to specify new firewall rules for carbon protocols and keep the rules updated - if you can already get HTTPS out of your network, even via a proxy, then it'll work.
By default, it exports CPU utilization, load average, processes, memory, disk, and network usage. It's easy to configure your own metrics.
A little about Prometheus
Prometheus is an open-source system monitoring and alerting toolkit. It consists of a time-series database, data exporters, Pushgateway, Alertmanager, API, and web UI. MetricFire also has a Hosted Prometheus service with a 14-day free trial.
Prometheus's main features include:
- a multi-dimensional data model with time series data identified by the metric name and key/value pairs
- PromQL, a flexible query language to leverage this dimensionality
- the time-series collection via a pull model over HTTP
- pushing time series supported via an intermediary gateway
- targets discovered via the service discovery or the static configuration
- multiple modes of graphing and dashboarding support

If we use Prometheus, the way that StatsD and collectd are used is different. Prometheus doesn't require collectors like StatsD or collectd for single-process applications, but data can still be exported from StatsD/collectd and sent to Prometheus if required. Multi-process applications are a different story.
Let's say we use Prometheus instead of Graphite in our pipeline for monitoring a Flask app. Multi-process applications are different, which means the basic configuration of Prometheus won't be able to monitor the app effectively. If we try to fetch the metrics from a non-trivial multi-process application, we will get unexpected results. Prometheus expects the application we are monitoring has the full responsibility for the absolute value of the metric. However, Flask apps have the process divided over many instances, and the Flask app itself is not able to sum the data of all of those instances and send one clean metric to Prometheus.
To illustrate this further, if we have 3 instances of our Flask application managed by a balance loader, none of them will really know the number of requests sent to the entire system. So, they can't send their values to Prometheus. Prometheus will see 3 separate jobs, not one job happening in three places.
The proposed solution is to use a middleware that will aggregate data and then send an absolute value to the metric storage. StatsD is a perfect candidate for this job. But not the only one - you can also store data from different workers/instances with a unique label and then aggregate with queries. You can use multi-process mode in Prometheus client for your language. Also, You can use a Prometheus Django client if you work with Python.
Interestingly enough, at MetricFire we monitor our own web-app using Prometheus. We have published an interesting tutorial on how this can be done based on our experience.
If you are using StatsD to pipe data from a Flask app into Prometheus, the good news is we already have an exporter for StatsD, so we can easily pull metrics with a minimum effort.
To try out Prometheus with the StatsD plugin, get on to the MetricFire free trial and start using Prometheus today. You can try it out directly in the app and see if you can aggregate all of your Flask app instances into one metric and monitor it with Prometheus, while skipping the installation and setup.
Ready to use metric services
Graphite and StatsD can produce a great amount of data, which becomes difficult to store. Handling this can involve a lot of packages during the installation. You might even be forced to deploy it on a separate server to deal with resource management. Also, an invalid configuration can lead to catastrophically inefficient memory usage (such as the invalid protocol for StatsD). That is why StatsD and Graphite as a Service can be a good decision. We provide Hosted Graphite and Hosted StatsD for you, so you can save time and energy. You can also find more documentation that will help you achieve your goals.
Conclusion
Collectd is a statistics collection daemon. It periodically polls various sources for metrics and can receive metrics as well. The plugin collection is quite exhaustive. Collectd is proficient in collecting metrics from the system, various popular services (web servers, database servers, etc), as well as from custom applications. In the case of custom applications, the applications are required to generate these metrics.
StatsD is an event counter/aggregation service. It receives per-event timings, then calculates and generates aggregated values. It is built to count and aggregate custom application metrics. It only requires the application to send events, without any need for aggregation.
You can use both these collectors at the same time. Using both collectors at the same time is seen consistently among our community.
To help you decide, take a look at the hosted services, such as Hosted Graphite and Hosted StatsD. You can try out the collectd and StatsD plugins right in the platform, and deploy metrics immediately. Remember, that Metricfire has a free 14-day trial which you can use to try things in practice. Also, in case of any questions, you can always get in touch with us.
Get similar stories in your inbox weekly, for free
Share this story:

MetricFire
MetricFire provides a complete infrastructure and application monitoring platform from a suite of open source monitoring tools. Depending on your setup, choose Hosted Prometheus or Graphite and view your metrics on beautiful Grafana dashboards in real-time.
Published by
MetricFire provides a complete infrastructure and application monitoring platform from a suite of open source monitoring tools. Depending on your setup, choose Hosted Prometheus or Graphite and view your metrics on beautiful Grafana dashboards in real-time.

Latest stories

Best Cloud Hosting in the USA
This article explores five notable cloud hosting offers in the USA in a detailed way.

Best Dedicated Hosting in the USA
In this article, we explore 5 of the best dedicated hosting providers in the USA: …


The best tools for bare metal automation that people actually use
Bare metal automation turns slow, error-prone server installs into repeatable, API-driven workflows by combining provisioning, …

HIPAA and PCI DSS Hosting for SMBs: How to Choose the Right Provider
HIPAA protects patient data; PCI DSS protects payment data. Many small and mid-sized businesses now …

The Rise of GPUOps: Where Infrastructure Meets Thermodynamics
GPUs used to be a line item. Now they're the heartbeat of modern infrastructure.

Top Bare-Metal Hosting Providers in the USA
In a cloud-first world, certain workloads still require full control over hardware. High-performance computing, latency-sensitive …

Top 8 Cloud GPU Providers for AI and Machine Learning
As AI and machine learning workloads grow in complexity and scale, the need for powerful, …

How ManageEngine Applications Manager Can Help Overcome Challenges In Kubernetes Monitoring
We tested ManageEngine Applications Manager to monitor different Kubernetes clusters. This post shares our review …

AIOps with Site24x7: Maximizing Efficiency at an Affordable Cost
In this post we'll dive deep into integrating AIOps in your business suing Site24x7 to …

A Review of Zoho ManageEngine
Zoho Corp., formerly known as AdventNet Inc., has established itself as a major player in …
