EC2 CloudWatch Metrics
in Serverless , Visualization , Monitoring and Observability , Error Tracking , Continuous Integration
In this article, we will see the significant EC2 metrics and make a dashboard with them using CloudWatch. Also, we'll check out the MetricFire integration with AWS that gives further flexibility to AWS users.
Over the past decade or two, we have seen an incredible advancement in the world of Cloud Computing. According to this 2018 Forbes article, “77% of enterprises have at least one application or a portion of their enterprise computing infrastructure in the cloud.” As more and more companies migrate their applications to the cloud, cloud providers have developed efficient ways to help these businesses monitor the state of their applications while providing useful insights into how best to optimize these applications.
Amazon Web Services, being the top cloud provider in terms of customer base, provides an extensive suite of applications to serve this purpose, with Amazon CloudWatch being its premier monitoring and observability offering. MetricFire integrates with AWS CloudWatch to give AWS users a second platform to make their monitoring dashboards more customized, and to integrate with a more diverse set of plugins. Sign up for the MetricFire free trial and integrate your CloudWatch with our Hosted Graphite and Grafana. You can also read more about our integrations on the Hosted Graphite Docs.
What is Amazon CloudWatch?
Amazon CloudWatch is a monitoring and observability service for AWS cloud resources and the applications running on AWS. CloudWatch seamlessly integrates with various compute services on the AWS platform, collecting logs and metrics for your apps that are running on those platforms. Using this data collected from your applications, CloudWatch can then provide you with actionable insights to help monitor your running applications, respond to system-wide performance changes, optimize resource utilization, and get a unified view of operational health. To read more about CloudWatch, refer to these MetricFire blogs: Kubernetes on AWS resources and Getting started with CloudWatch.
One of the services CloudWatch integrates with is Amazon’s Elastic Compute Cloud ( EC2 ), which is AWS’ main virtual machine compute offering. Given that EC2 instances, more often than not, serve as the core computing workers for most applications running on AWS, monitoring their “health” and performance is imperative. This monitoring is done with the use of certain metrics captured and processed by CloudWatch, and forms the basis of this article.
Amazon EC2 instances emit vast amounts of raw data and statistics on the state of its processes, its health, and its performance. This data is collected by CloudWatch, which is integrated into the EC2 suite, and is processed into readable, near real-time metrics, which are then displayed using easy to read graphs directly from the EC2 console. By default, EC2 instances spit out this data to CloudWatch in 5-minute periods, but if you want more granularity, you could enable detailed monitoring for your instances either before you create them, or for an already running instance using the EC2 console or the AWS CLI. Detailed monitoring allows CloudWatch to collect EC2 data in 1 minute granularities. More on this can be found in the AWS documentation here.
What are the different types of metrics collected by CloudWatch?
Amazon EC2 instances send raw data to CloudWatch about status, health and performance in the form of metrics. This data is sent every 5 minutes by default, or every minute if detailed monitoring is enabled. Given the possibly endless use cases of EC2 instances, there exist a vast amount of metrics that can be collected by CloudWatch to track literally every single aspect of these instances.
Instance Metrics
These metrics track the state of certain core operations on your instances. They Include:
- CPUUtilization: This metric tracks the cpu utilization of the underlying EC2 instance as a percentage of its allocated EC2 compute units. In other words, it tracks, as a percentage, the amount of allocated EC2 compute units that are currently in use on the instance.
- DiskReadOps: This metric tracks the number of completed read operations from all instance store volumes available to the instance in a specified period of time.
If there are no instance store volumes, either the value is 0 or the metric is not reported:
- DiskWriteOps: This metric tracks the number of completed write operations to all instance store volumes available to the underlying instance in a specified period of time. If there are no instance store volumes attributed to this instance, either the value is 0 or the metric is not reported.
- DiskReadBytes: This tracks the amount of data, in bytes, read from all instance store volumes available to the instance over a period of 5 minutes for the basic monitoring and 1 minute for detailed monitoring. This metric is used to determine the volume of the data the application reads from the hard disk of the instance and can be used to determine the speed of the application. If there are no instance store volumes for this instance, either the value is 0 or the metric is not reported.
- DiskWriteBytes: This metric records the amount, in bytes written, to all instance store volumes available to the instance over a period of 5 minutes for the basic monitoring and 1 minute for detailed monitoring. It tracks how fast the application writes data to its underlying disk, and thus can be used to infer the speed of the application. If there are no instance store volumes for this instance, either the value is 0 or the metric is not reported.
- NetworkIn and NetworkOut: These metrics track the amount of bytes transferred on all network interfaces by the instance, with the former (NetworkIn) recording the amount of bytes received and the latter (NetworkOut) recording the amount of bytes sent out. These trackings are done with respect to the recording period, that is, these metrics record the amount of bytes transferred in a 5 minute period for the basic monitoring, and 1 minute period the detailed monitoring.
- NetworkPacketsIn and NetworkPacketsOut: These metrics track the number of packets received (NetworkPacketsIn) and sent out (NetworkPacketsOut) on all network interfaces by the instance. They identify the volume of incoming and outgoing traffic in terms of the number of packets on a single instance. These metrics are available for basic monitoring only.
- MetadataNoToken: This metric tracks the number of times the instance metadata service was successfully accessed using a method that does not use a token. It is used to determine if there are any processes using Instance Metadata Service Version 1 to access instance metadata (Instance Metadata Service Version 1 does not use a token). If all requests use token-backed sessions, i.e., Instance Metadata Service Version 2, the value is 0.
CPU Credit Metrics
There are certain EC2 instance types (T3, T3a, and T2 instances) called burstable performance instances, which are designed to provide a baseline level of CPU performance with the ability to burst to a higher level of performance when required by your workload. This burst capacity is governed by CPU credits - generally, the more CPU credits an instance accumulates over time, the longer its burst capacity. The following CPU metrics are available just for burstable instances as they help to track available credits and credit usage. One thing to note is, these metrics are not available for detailed monitoring:
- CPUCreditUsage: This metric tracks the number of CPU credits consumed by the instance for CPU utilization over a period of 5 minutes. One CPU credit is equivalent to one vCPU running at 100% capacity for one minute or an equivalent combination of vCPUs, time, and capacity (for example, one vCPU running at 50% capacity for two minutes or two vCPUs running at 25% capacity for two minutes).
- CPUCreditBalance: This tracks the number of earned CPU credits that an instance has accrued since it was launched or started. In other words, it tracks the number of CPU credits available to an instance ( total credits amassed over time minus the total credits the instance has used in previous bursts).
- CPUSurplusCreditBalance: This tracks the number of surplus credits that have been spent by an unlimited instance ( an unlimited instance is a burstable instance that has been configured to run in unlimited mode, that is, it can sustain performance bursts whenever and however long it requires) when its CPUCreditBalance value is zero. Surpluses are paid back by earned CPU credits, but if this surplus goes over the maximum cpu credit this instance can earn in a 24 hour period, you may incur an additional charge.
- CPUSurplusCreditsCharged: This tracks the number of spent surplus credits that are not paid back by earned CPU credits, and which thus incur an additional charge.
EBS metrics for Nitro Based Instances
There exist a special category of metrics to track the read and write speeds of Nitro Based instances using Elastic Block Storage ( EBS ). In an effort to keep this article within a reasonable length, you can head over here to read about these metrics given that this would require a certain understanding of what Nitro Based instances are.
Status Check Metrics
This set of metrics record data on the status of your instance. By default, they are available at a 1-minute frequency at no charge. For a new instance, status check metric data is available only after the instance has completed the initialization state.
- StatusCheckFailed: This is a boolean metric that reports whether the instance has passed both the system status check and the instance status check in the last minute. It can be either 0 (passed) or 1 (failed).
- StatusCheckFailed_Instance: This is a boolean metric, similar to StatusCheckFailed, but it only tracks whether the instance has passed the instance status check in the last minute.
- StatusCheckFailed_System: Similar to the StatusCheckFailed_Instance, but only tracks whether the instance passed the system status check in the last minute.
The StatusCheckFailed metric can be seen as a combination of StatusCheckFailed_Instance and StatusCheckFailed_System metrics.
Amazon EC2 Usage Metrics
Usage metrics are CloudWatch metrics meant to help provide visibility into your account's usage of resources. Currently, the only usage metric available for EC2 instances is the ResourceCount metric, which tracks the number of the specified resources running in your account. The resources are defined by the dimensions set with the metric. These dimensions include
- Service: This refers to the name of the AWS service containing the resource being tracked. In this case, the service name is EC2.
- Type: This specifies the type of entity that is being tracked, in this case, a Resource.
- Resource: This specifies the type of resource being tracked, and the only valid value for EC2 usage metrics is vCPU.
- Class: This specifies the class of the resource being tracked. For EC2 instances, the valid values are Standard/OnDemand, F/OnDemand, G/OnDemand, Inf/OnDemand, P/OnDemand, and X/OnDemand.
You can use this metric to visualize your current EC2 usage on CloudWatch graphs and dashboards and you can set alarms on these metrics to ensure your EC2 usage does not exceed certain quotas.
All of these metrics and more are easily accessible from the EC2 dashboard for each instance. Check out the picture below for a view of how these metrics are graphed in the Monitoring tab of the EC2 dashboard for a demo instance I have running.
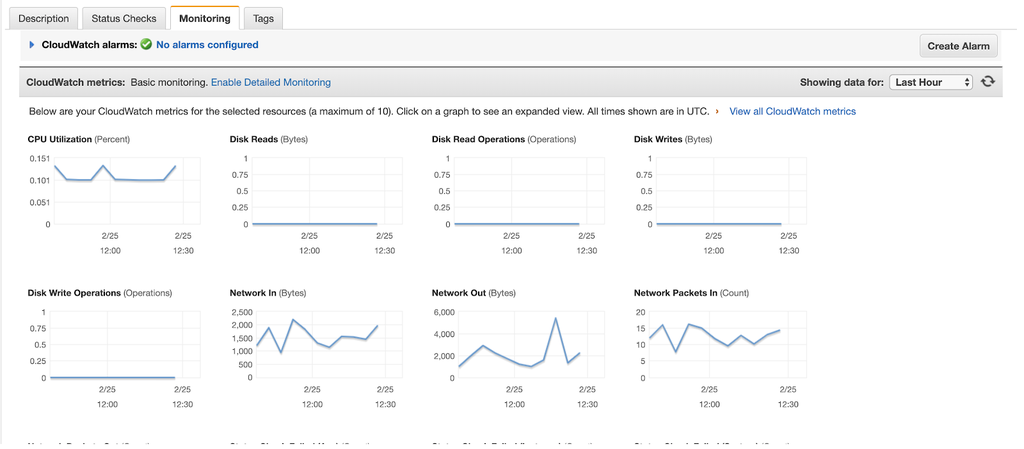 EC2 CloudWatch Metrics
As mentioned earlier, monitoring the state of your instances is imperative to keeping your applications healthy, and using the above metrics (and the many others) provided by AWS, you can achieve this with relative ease.
Integrating with MetricFire
Many CloudWatch users become interested in MetricFire when they are looking for a secondary platform that offers more flexibility. MetricFire allows for a broad set of plugins, such as those through Grafana labs, as well as unlimited dashboarding, querying and alerting.
You can actually connect your AWS CloudWatch account to MetricFire so you can reduce the amount of metrics you monitor with CloudWatch, while still getting the benefit of monitoring the essentials with CloudWatch.
MetricFire's hosted Graphite provides an Amazon AWS CloudWatch add-on available in the Add-Ons page of your account. This add-on syncs the metrics from the specified AWS services/regions into your account.
To connect to your CloudWatch account, you need to set up Identity and Access Management (IAM) access keys in your AWS Account, with the appropriate permissions to allow MetricFire's Hosted Graphite to connect and collect your metrics.
Conclusion
In this article, we have seen how to use EC2 CloudWatch metrics, from understanding their role within the AWS environment to dashboarding EC2 metrics in CloudWatch.
For more information, check out the MetricFire blog for articles on Getting Started With CloudWatch, CloudWatch Pricing, and CloudWatch Alternatives.
Sign up for the MetricFire free trial to explore what MetricFire has to offer, and to try the AWS integration. Also, speak with the MetricFire team directly by booking a demo and talk with us about how to best monitor your EC2 setup.
Get similar stories in your inbox weekly, for free
Share this story:

MetricFire
MetricFire provides a complete infrastructure and application monitoring platform from a suite of open source monitoring tools. Depending on your setup, choose Hosted Prometheus or Graphite and view your metrics on beautiful Grafana dashboards in real-time.
Published by
MetricFire provides a complete infrastructure and application monitoring platform from a suite of open source monitoring tools. Depending on your setup, choose Hosted Prometheus or Graphite and view your metrics on beautiful Grafana dashboards in real-time.

Latest stories

Best Cloud Hosting in the USA
This article explores five notable cloud hosting offers in the USA in a detailed way.

Best Dedicated Hosting in the USA
In this article, we explore 5 of the best dedicated hosting providers in the USA: …


The best tools for bare metal automation that people actually use
Bare metal automation turns slow, error-prone server installs into repeatable, API-driven workflows by combining provisioning, …

HIPAA and PCI DSS Hosting for SMBs: How to Choose the Right Provider
HIPAA protects patient data; PCI DSS protects payment data. Many small and mid-sized businesses now …

The Rise of GPUOps: Where Infrastructure Meets Thermodynamics
GPUs used to be a line item. Now they're the heartbeat of modern infrastructure.

Top Bare-Metal Hosting Providers in the USA
In a cloud-first world, certain workloads still require full control over hardware. High-performance computing, latency-sensitive …

Top 8 Cloud GPU Providers for AI and Machine Learning
As AI and machine learning workloads grow in complexity and scale, the need for powerful, …

How ManageEngine Applications Manager Can Help Overcome Challenges In Kubernetes Monitoring
We tested ManageEngine Applications Manager to monitor different Kubernetes clusters. This post shares our review …

AIOps with Site24x7: Maximizing Efficiency at an Affordable Cost
In this post we'll dive deep into integrating AIOps in your business suing Site24x7 to …

A Review of Zoho ManageEngine
Zoho Corp., formerly known as AdventNet Inc., has established itself as a major player in …
