Grafana Data Sources

Grafana is a popular tool for doing monitoring and analytics. It allows us to build dashboards to visualize, query, analyze data, and to set up alert notifications for certain conditions. To start from the beginning, check out our article on Grafana Dashboards, and our article called Getting Started with Grafana. This article will go in-depth on the most popular Grafana data sources and how to use them.
Get started by signing up for the MetricFire free trial, where we have a Hosted Grafana Service that you can use without any installation or configuration. This free trial will let you follow along with this article by using Grafana directly in your browser.
What is a data source
Grafana works with data, which must be stored in a database before it can be accessed by Grafana. There are several different kinds of databases. Additionally, some other systems can be used to store data, even though their main purpose is not focused on data storage.
A Grafana data source is any place from which Grafana can pull data. In other words, you don’t need to load data into Grafana to analyze it. Instead, you should create a connection between Grafana and the data source. Grafana will then work with the connected data source to analyze the data stored there and derive some insights and perform monitoring.
How to add a data source in Grafana
To add a data source in Grafana, you should hover over the gear icon at the top right (Also called the Configuration menu) and then click on the Data Sources button:

In the Data Sources section of the Configuration menu, you can press the Add data source button. In the screenshot below you can see that we’ve already added data sources such as Hosted Graphite and Metricfire-Prometheus. If you have a fresh local installation of Grafana, you will not see any data sources here until you add them. In general, this is the place where you can view all of your connected data sources.

When you click the Add data sources button, you will see the list of officially supported data sources available for connection:
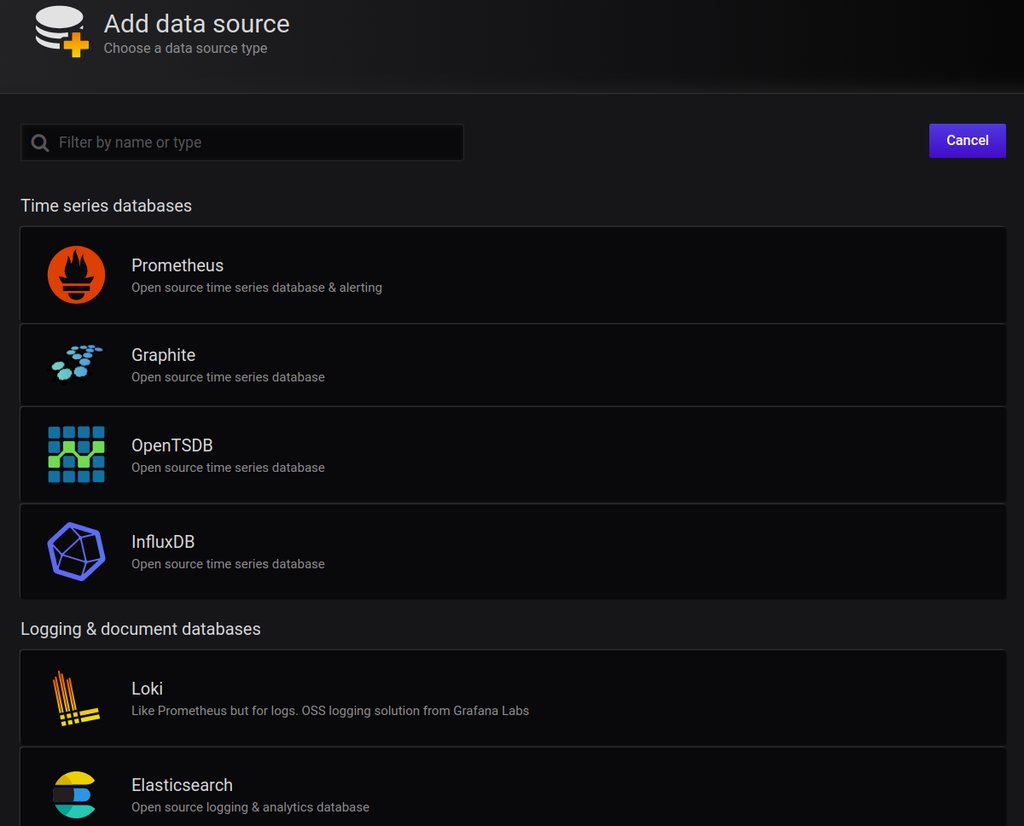
Select the preferred data source and click on it. The next step will be to specify the required parameters (URL, authorization details, names, etc.):

After you finish filling in the required parameters, you need to press the Save & Test button:

When Grafana establishes the connection, you will see the corresponding message. Then, you can go to the Dashboards section and start exploring the data from the connected data source.
Popular Grafana data sources
Let’s now explore and briefly describe the data sources that are available “out of the box” in Grafana. We can split them into a few key groups:
- Cloud data sources
In this group you will find the monitoring solutions from the huge cloud providers:
AWS CloudWatch
CloudWatch is the tool for application and resource monitoring. It works both with cloud-based solutions and on-premises.
Azure Monitor
Azure Monitor is the monitoring solution from Microsoft. It provides services for tracking applications, infrastructure, and network.
Google Stackdriver
Stackdriver is a similar monitoring service from Google. - SQL data sources
In this group you will see the most popular relational databases.
PostgreSQL
The advanced object-relational database. It provides many features that are not available in other similar instruments. If you have the data with timestamps in PostgreSQL you can use this plugin to visualize it in Grafana.
MySQL
Probably the most popular relational database today. Again, time-series data from MySQL can be effectively visualized in Grafana.
Microsoft SQL Server
MS SQL Server is the “third whale” in the relational databases zoo along with PostgreSQL and MySQL. - Time series databases
Time series data is the best type of data for monitoring and visualizing in Grafana.
InfluxDB
One of the most popular databases for storing time-series data. InfluxDB is a part of the TICK-stack: the collection of tools for collecting, storing, and analyzing time-series data. Chronograph is the tool from the TICK-stack that plays the same role as Grafana, but Grafana is considered a more flexible and versatile solution.
Prometheus
Prometheus is a well-known time-series database and monitoring tool. Prometheus is a time-series database that includes tagging, monitoring and querying functionality. Metricfire provides Hosted Prometheus for easy installation, configuration, and usage.
Graphite
Graphite is a convenient monitoring tool. It can be installed on-premise or in the cloud. Graphite’s time-series database is not cluster native, and doesn’t have as versatile tagging functionality as Prometheus. However, MetricFire’s Hosted Graphite service has expanded upon the open source projects and now offers these features.
OpenTSDB
OpenTSDB is a scalable time-series database and monitoring system. - Logging and document databases:
Elasticsearch
Elasticsearch is a powerful search engine that can also be used as the NoSQL database.
Loki
Loki is the log-aggregation system from Grafana. - Others
There are some other officially supported data sources:
- SimpleJson
- Logz.io
- TestData DB
Popular community-driven Grafana data sources
Let’s describe some popular community-driven data sources.
Cloudera Manager
Cloudera Manager is the tool for Apache Hadoop administration. It also provides functionality for monitoring and reporting. Using this plugin you can connect the Cloudera Manager to Grafana and build dashboards using data collected from the Hadoop cluster.
Consul
Consul is the solution for connecting cloud services and securing them. This helps move from static to dynamic architecture. Consul collects metrics that reflect the health and performance of the connected services, which you can monitor in Grafana.
Druid
Apache Druid is a real-time analytics database. With the community-supported plugin, you can access the data stored in Apache Druid from Grafana.
Google BigQuery
Google BigQuery is a well-known cloud data warehouse that allows reliable storage of data and efficient analytics.
Google Calendar
This plugin could be used to access information about events scheduled with Google Calendar. For each event, there is the start and end time, that’s how the transformation to the time-series view occurs.
IBM APM
IBM Cloud Application Performance Management enables application monitoring. With this plugin, you can collect and visualize metrics from IBM APM in Grafana.
Oracle Cloud Infrastructure
This plugin allows running queries against the Oracle Cloud Infrastructure Monitoring tool.
ClickHouse
ClickHouse is a popular open-source column-oriented database often used for storing information about events in web analytics, gaming software, etc. Events (for example, user clicks) usually have date-time fields, which makes it possible to transform to time-series data and analyze it in Grafana.
Finance
This plugin is developed for fetching data from Quandl API - a financial data provider. Financial data is usually time-series data, so it can be used easily in Grafana.
DarkSky
DarkSky API provides you with historical information about the weather conditions and future forecasts. This plugin allows you to monitor the weather in Grafana, which could be very important for many applications and use cases.
The list above is incomplete. There are many other community-driven data source plugins. In addition, developers constantly create new data sources and make them available for the community. So, if you need a specific data source, it is always a good idea to check the page for community-supported data source plugins.
Installing third-party data sources
As you remember, when you click on the Add data source button, you will be presented with the list of officially supported data sources. If you scroll the page down, you will see the "Find more data source plugins on grafana.com" link:
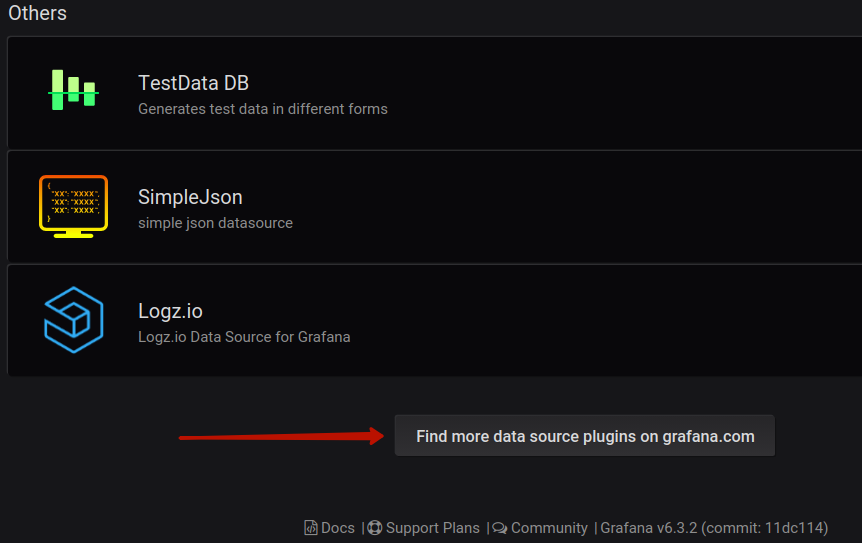
If you follow this link, you will see the page with the available plugins (you can see the selection menu on the left hand side, showing the plugin type as data source):

The officially supported plugins are denoted as “by Grafana Labs”, while community-supported plugins show the names of their developers:

If you click on any of the data sources provided here, you will enter the page with the details about the plugin and the installation information:

After you install the plugin, the data source should appear in the list of the available data sources in your Grafana UI.
You can find more detailed instructions about plugin installation here.
Creating custom data sources
If you cannot find the needed data source among the officially supported or community-provided ones, you can create your own data source. The idea is that a custom plugin can be created for any database that uses HTTP protocol for communication with clients. The plugin should transform data from the database into time-series data for Grafana to be able to correctly represent it in the dashboard's visualizations.
To develop a plugin for the new data source, three components are required:
- Data source JavaScript object (responsible for communication with the database and transformation of the stored data)
- QueryCtrl JavaScript class (for editing metrics in the dashboards’ panels)
- ConfigCtrl JavaScript class (for performing the configuration of the new data source of this type, or editing it by the user)
You can read more about the creation of custom data sources in this documentation.
Conclusion
This article explored Grafana data sources and explained how to work with them. We described a range of popular officially supported data sources, as well as community-driven plugins. Finally, we introduced the process of installing third-party data sources and creating your own data sources.
If you want to use Grafana for your monitoring or data analysis needs, don’t forget that we have a 14-day free trial for Grafana as a Service. If you have any questions, please contact us or write to sales@metricfire.com.
Get similar stories in your inbox weekly, for free
Share this story:

MetricFire
MetricFire provides a complete infrastructure and application monitoring platform from a suite of open source monitoring tools. Depending on your setup, choose Hosted Prometheus or Graphite and view your metrics on beautiful Grafana dashboards in real-time.
Published by
MetricFire provides a complete infrastructure and application monitoring platform from a suite of open source monitoring tools. Depending on your setup, choose Hosted Prometheus or Graphite and view your metrics on beautiful Grafana dashboards in real-time.

Latest stories

Best Cloud Hosting in the USA
This article explores five notable cloud hosting offers in the USA in a detailed way.

Best Dedicated Hosting in the USA
In this article, we explore 5 of the best dedicated hosting providers in the USA: …


The best tools for bare metal automation that people actually use
Bare metal automation turns slow, error-prone server installs into repeatable, API-driven workflows by combining provisioning, …

HIPAA and PCI DSS Hosting for SMBs: How to Choose the Right Provider
HIPAA protects patient data; PCI DSS protects payment data. Many small and mid-sized businesses now …

The Rise of GPUOps: Where Infrastructure Meets Thermodynamics
GPUs used to be a line item. Now they're the heartbeat of modern infrastructure.

Top Bare-Metal Hosting Providers in the USA
In a cloud-first world, certain workloads still require full control over hardware. High-performance computing, latency-sensitive …

Top 8 Cloud GPU Providers for AI and Machine Learning
As AI and machine learning workloads grow in complexity and scale, the need for powerful, …

How ManageEngine Applications Manager Can Help Overcome Challenges In Kubernetes Monitoring
We tested ManageEngine Applications Manager to monitor different Kubernetes clusters. This post shares our review …

AIOps with Site24x7: Maximizing Efficiency at an Affordable Cost
In this post we'll dive deep into integrating AIOps in your business suing Site24x7 to …

A Review of Zoho ManageEngine
Zoho Corp., formerly known as AdventNet Inc., has established itself as a major player in …
