Grafana vs PowerBI - Using Grafana for your business metrics
PowerBI is a powerful tool for business intelligence. Its main designation is analysis and visualization of business metrics. It has perfect integration with other Microsoft products like Office 365, Azure, Power Apps, Power Virtual Agents, etc.
PowerBI is a powerful tool for business intelligence. Its main designation is analysis and visualization of business metrics. It has perfect integration with other Microsoft products like Office 365, Azure, Power Apps, Power Virtual Agents, etc. Also, it supports easy sharing by displaying the visualizations on different platforms: desktop, via the web app, or even on mobile devices.
Grafana is the acknowledged leader in the market of monitoring tools. It can take any form of time-series data and turn it into great dashboards and visualizations. Grafana is a great open source tool for monitoring business metrics, and it is also used to monitor infrastructure, application performance, and even IoT devices. If you're looking to avoid the time-consuming setup of open source projects, MetricFire runs a Hosted Grafana that allows you to use Grafana without doing any installation.
Grafana is an especially good solution for companies looking to monitor different metrics across divisions. By building beautiful visualizations and aggregating them into multi-faceted dashboards, Grafana lets you track everything you want. It also has plenty of plugins to work with different 3rd-party systems. In addition, it can trigger alerts and notify you about certain events during monitoring.
We have a lot of resources at MetricFire to help you get familiar with Grafana. See our Grafana vs PowerBI, Grafana vs Kibana, and Grafana Plugins posts, as well as many other articles in our blog. You can also try Grafana on your own using our free trial. The free trial is a great way to try out Grafana and see if it suits your needs.
In this article, we will show you how Grafana can be used for business metrics. We will take a look at the best dashboards for business metrics monitoring, and how to set them up.
What are business metrics
Business metrics are indicators reflecting the performance of the company, the department, or even the individual employee. Business metrics help stakeholders to analyze how well the business processes are working, without diving deeply into the financial statements. Also, business metrics are important for operative management of the company.
There are many common business metrics that are used widely by different companies. At the same time, each company or division can invent their own custom metrics, specific only for their industry or use cases. The most well-known metrics include sales revenue, net profit margin, working capital, customer retention, customer acquisition, net promoter score, website traffic, conversion, etc. In this article on ntaskmanager.com, you can find many other interesting metrics with the explanation about each one.
Grafana’s features for working with business metrics
There are three central components of Grafana that allow the implementation of business metrics analysis: panels, dashboards, and the reporting functionality.
The panel is the basic element in Grafana that represents visualization. With a panel, you can create a plot that visualizes the given metric or even several metrics. When the panel is ready, you can share it with your coworkers.
The dashboard is simply a collection of panels. Having all visualizations in one place you can comprehensively understand what is going on with the business. When the dashboard is ready, you can use the reporting functionality of Grafana to automatically and regularly create PDF reports and share them among stakeholders.
There are several kinds of panels, each is responsible for a particular visualization type.
The Graph panel is one of the most used panels. It can be created in the form of a line chart (when the x-axis is time), series chart (when the x-axis is the categories of values), or histogram (the bar chart which shows the distribution of values).
For example, a line chart can be used to visualize business metrics that vary frequently over time (say, a website’s traffic). Series charts are good for visualizing sales by different products, business divisions, geographical locations, etc. Distributions of many metrics are also very interesting for businesses. For instance, a histogram type can be used to show the distribution of net promotion scores given by the clients.
Below you can see the example of a graph panel with the website’s traffic visualization.
 Table panel
Table panel is a convenient form of representation for some business metrics. Probably, it should be used in cases where there is a lot of important data to show, and the stakeholders are more interested in seeing a complete information overview than fancy visualizations. Using table panels you can mark values as “good”, “warning”, “critical”, or as other states by changing the colour of the box. For example, if you have a table showing customer churn by different subscription plans, the values from the “normal” range can be highlighted with the green color, values that are slightly higher could be marked by yellow, and the significantly higher values would be red.
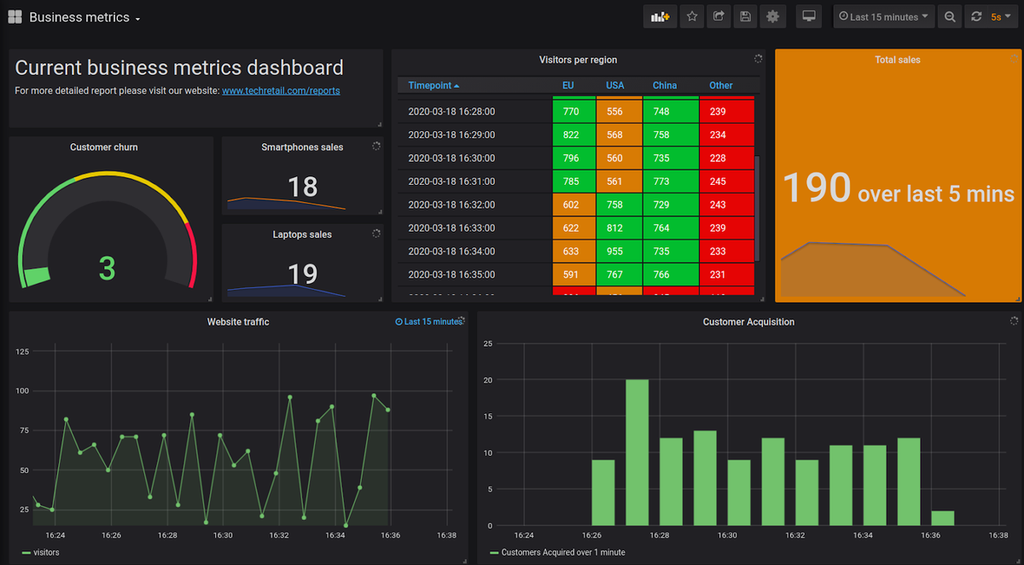
Below you can find an example of a table panel that displays the total number of visitors to the firm’s website over the latest minute split by the region:
 Stat panel
Stat panel can be used to show a set of single business metrics across different categories. For example, to show the number of sales of each of the firm’s products. At the same time, under each value, you can see the simple graph that allows you to understand the past and current dynamics of this value. As with all panels, you can also tweak background and value colors, alignment, etc.
Gauge panel is a way of visualizing business metrics that can vary quickly over short periods of time. An example could be the website’s traffic. However, this is not a classic visualization for most business metrics, it is rather a monitoring tool. So, you need to decide whether you require it in your particular case.
Below you can see an example of how the gauge panel, which represents customer churn, could look like. It shows that currently we have 3 customers who churned over the specified period of time. If the number grows, it can reach the yellow region, which means that the churn is higher than usual. When the value is in the red region, this means that the churn is of the critical level, and the urgent measures should be taken.
 Bar gauge panel
Bar gauge panel is similar to the gauge panel visualization tool. The gauges are in the form of bars. The use case for a bar gauge panel is the same as for the gauge panels. Usage for business metrics is limited but possible.
Singlestat panel is somewhat similar to stat panel. It also displays a single value, but it gets this value by summarizing the time-series (by computing the average, the sum of values, or min or max values). It is possible to customize a singlestat panel by prefix, postfix, specifying units, and representing information as the text value (for example: “Clicks: 25% from target users”).
On the image below you can see three Singlestat panels that represent information about smartphones, laptops, and total sales of all products over the last 5 minutes.
 text panel
The text panel is an auxiliary panel when building dashboards. They are used to describe something, add additional explanations, etc.
Here is the example of the text panel:
 Sample text panel
Business Metrics generation and data sources
In order to use Grafana as a tool for business metrics visualization and analysis, you must have a connected data source. An example pipeline can be as follows: Your systems generate metrics and send them to a database. A database can be any kind of time-series database that works best for you, such as InfluxDB, TimescaleDB, Prometheus, or Graphite. Then you create a data source for this database in Grafana. Grafana is just a dashboard, so the information needs to exist before it gets piped into Grafana.
Business metrics can be generated in many ways. The most direct and simple metrics are used for financial data that are not updated very frequently (like net income over the period of time, return on investments, etc.). Usually, they are calculated once a period and then can be manually pushed into the relational database.
Another way is generating the information from your web or mobile applications. They generate a lot of frequent events and data, which can be pushed to the database by the application’s backend, or processed by special application monitoring tools. The examples of such systems are Elastic APM, IBM APM, Traceview, Sematext APM, Dynatrace, etc. These can then be added as data sources in Grafana.
One more approach to get business metrics is sending them directly from your CRM system. Here are several popular CRMs: Salesforce, HubSpot, ZohoCRM, Pipedrive.
Try out the Grafana free trial here, and see if you can set up your business metrics. If you run into any issues, book a demo with the MetricFire team directly, and we’ll help you set up your business monitoring.
The best databases for visualizing business metrics in Grafana
As mentioned in the previous section, regardless of how the data was generated, the data needs to be pushed into a database. Grafana can then easily add that database as a data source and your graphs will be populated with information. But which databases are the best for visualizing business metrics in Grafana?
The advantage of Grafana is that it can be easily integrated with a wide range of different data sources. There are many officially supported sources, but you can find even more among the 3rd-party plugins.
Relational databases are the most commonly used storage for business data. PostgreSQL, MySQL, and Microsoft SQL Server are good for storing financial data or data that is not frequently changed.
When you want to collect some metrics from your website, a time-series database like InfluxDB can be used. Prometheus is also a good option because it can work with time-series data well and also can be used as a monitoring platform. MetricFire offers Hosted Prometheus as a part of all business metrics monitoring platforms, so this is the best option for Grafana users coming in through MetricFire.
Google BigQuery is a well-known cloud data warehouse which is used by many companies for storing their business metrics data. Grafana has a plugin that allows you to connect BigQuery. The MetricFire team can set up this plugin for our users.
ClickHouse is the relational database for storing data about events (for example, clicks on your website, new online orders, visits, etc.). Grafana has a corresponding plugin to connect ClickHouse as well.
Finally, if there is a need, it is possible to create your own custom data source. You can read more about data sources in Grafana in our article.
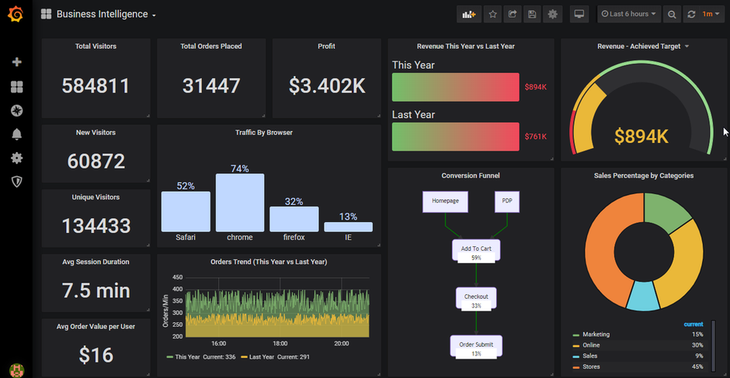
Example of a dashboard with business metrics
Let’s now look at what a dashboard with business metrics can look like.
You can drag-and-drop different panels over convenient locations, change colors, markers, sizes, etc. The dashboard is completely dynamic and interactive.
You can also share the dashboard by pressing the share button in the top right region of the screen. Then you will have several options to specify:

Grafana is notoriously shareable and is a great way to tell your colleagues about the information they need to know.
Conclusion
In this article, we have demonstrated how Grafana could be used for visualizing and tracking your business’ metrics. We briefly described the nature of business metrics, and then gave some examples of Grafana panels that could be useful in business metrics visualization. For more information on how to set up Grafana dashboards, check out Getting Started with Grafana Dashboards, and Our Favorite Grafana Dashboards.
While PowerBI is very popular in this field, Grafana provides a broad set of functionality that allows performing business analytics on a very advanced and powerful level. Grafana can do much more than just business analytics, and so it is an especially good solution for companies that are also monitoring infrastructure, networks and IoT.
If you have any questions you can get in touch with us. Don’t forget that you can also use MetricFire’s free 14-day trial to have some practice with Grafana as a Service.
Get similar stories in your inbox weekly, for free
Share this story:

MetricFire
MetricFire provides a complete infrastructure and application monitoring platform from a suite of open source monitoring tools. Depending on your setup, choose Hosted Prometheus or Graphite and view your metrics on beautiful Grafana dashboards in real-time.
Published by
MetricFire provides a complete infrastructure and application monitoring platform from a suite of open source monitoring tools. Depending on your setup, choose Hosted Prometheus or Graphite and view your metrics on beautiful Grafana dashboards in real-time.

Latest stories

Best Cloud Hosting in the USA
This article explores five notable cloud hosting offers in the USA in a detailed way.

Best Dedicated Hosting in the USA
In this article, we explore 5 of the best dedicated hosting providers in the USA: …


The best tools for bare metal automation that people actually use
Bare metal automation turns slow, error-prone server installs into repeatable, API-driven workflows by combining provisioning, …

HIPAA and PCI DSS Hosting for SMBs: How to Choose the Right Provider
HIPAA protects patient data; PCI DSS protects payment data. Many small and mid-sized businesses now …

The Rise of GPUOps: Where Infrastructure Meets Thermodynamics
GPUs used to be a line item. Now they're the heartbeat of modern infrastructure.

Top Bare-Metal Hosting Providers in the USA
In a cloud-first world, certain workloads still require full control over hardware. High-performance computing, latency-sensitive …

Top 8 Cloud GPU Providers for AI and Machine Learning
As AI and machine learning workloads grow in complexity and scale, the need for powerful, …

How ManageEngine Applications Manager Can Help Overcome Challenges In Kubernetes Monitoring
We tested ManageEngine Applications Manager to monitor different Kubernetes clusters. This post shares our review …

AIOps with Site24x7: Maximizing Efficiency at an Affordable Cost
In this post we'll dive deep into integrating AIOps in your business suing Site24x7 to …

A Review of Zoho ManageEngine
Zoho Corp., formerly known as AdventNet Inc., has established itself as a major player in …
