Graphite vs Prometheus
in Containerization , Visualization , Monitoring and Observability

Graphite and Prometheus are both great tools for monitoring networks, servers, other infrastructure, and applications. Both Graphite and Prometheus are what we call time-series monitoring systems, meaning they both focus on monitoring metrics that record data points over time.
Graphite and Prometheus are both great tools for monitoring networks, servers, other infrastructure, and applications. Both Graphite and Prometheus are what we call time-series monitoring systems, meaning they both focus on monitoring metrics that record data points over time. At MetricFire we offer hosted versions of both Graphite and Prometheus, so our users can try them out on our free trial and see which works better in their case.
This article will look into the similarities and differences of Graphite and Prometheus, and give recommendations on when to use each product.
Graphite
Graphite is a legacy monitoring tool that is tried and true. Graphiteapp first came out in 2008, and was remarkably successful as it was one of the first in the playing field. Hosted Graphite came on to the scene in 2012, and fixed the issues that the open source Graphite was having, while simultaneously offering a fully serviced solution.
The Graphite stack can be customized depending on the tools you like to use, but a typical installation will have the following components:
- StatsD and collectd for collecting metrics
- Carbon for receiving and aggregating metrics
- Graphite server
- Whisper as a time-series database
- Grafana as a time-series metrics visualization tool
You can see a basic outline of the Graphite Architecture here:

Check out our articles on the structure and architecture of Graphite and the installation of Graphite to learn more.
When trying to run Graphite at the production level, users tend to find the same problems over and over again. Dealing with cluster native storage, data redundancy, flexible data aggregations, dashboard sharing, and processing large quantities of data have all been issues with Graphite. Many people in our community find that Graphite is very easy to use until trying to deploy it at a larger scale. This is where MetricFire's hosted Graphite can help. Book a demo if you want to find out how MetricFire can help with your Graphite monitoring.
Prometheus
Prometheus is a newer tool that has a broader set of functionality built in, so Prometheus users don’t need to install various plugins or daemons to get the service up and running. In fact, Grafana is even included alongside Prometheus in the first install.
Prometheus doesn’t require StatsD or collectd to push data to the server, instead Prometheus pulls data from the clients. This can cause some challenges, especially when the client doesn’t have data for Prometheus to pull. In situations where the client will always irregularly produce data points, it is still a good idea to use StatsD or collectd when monitoring with Prometheus.
The data storage architecture for Prometheus is extremely helpful for aggregating data, making Prometheus more effective for data aggregation than the open source Graphite. Each metric in Prometheus is also recorded with a label, allowing users to break down metrics into groups and subgroups for looking at different sets of data.
For more information about the structure of Prometheus, check out our article Prometheus Monitoring 101. This article outlines everything you need to know to get a basic understanding of Prometheus.
Getting Prometheus to work with services such as Kubernetes and Docker is easier than with Graphite, especially because there is broad community support for Prometheus monitoring of Kubernetes and docker. For more information in this area, check out our video tutorial on deploying Prometheus to Kubernetes.
Prometheus is easier to scale up than Graphite, though the main issue that engineers have is the long-term storage of data. Open source Prometheus only stores data for up to 14 days, making record keeping and forecasting with your data very difficult. One way to work around this problem is to configure remote storage. However, configuring remote storage can cause many issues, as maintaining and monitoring the storage is time consuming. Visit our Hosted Prometheus page to find out how Prometheus can help with scaling your Prometheus.
Graphite vs. Prometheus: the dashboards
When it comes to dashboarding for Graphite and Prometheus, it is most common to use Grafana for both solutions. Grafana is a very versatile dashboard tool that allows you to import data from many different data sources. Some users will have data from Prometheus, StatsD, and Elasticsearch all visualized in the same Grafana dashboard. Grafana is also a great tool because there is a broad set of plugins allowing you to create the dashboard that you need.
Here is an example of a Grafana dashboard monitoring a Prometheus data source:

Find out how this Grafana dashboard is built in our article, Our Favorite Grafana Dashboards.
Graphite and Prometheus both have their own dashboards that can be used if you don’t have Grafana. Graphite has the Graphite Web UI and Prometheus has the Expression Browser.
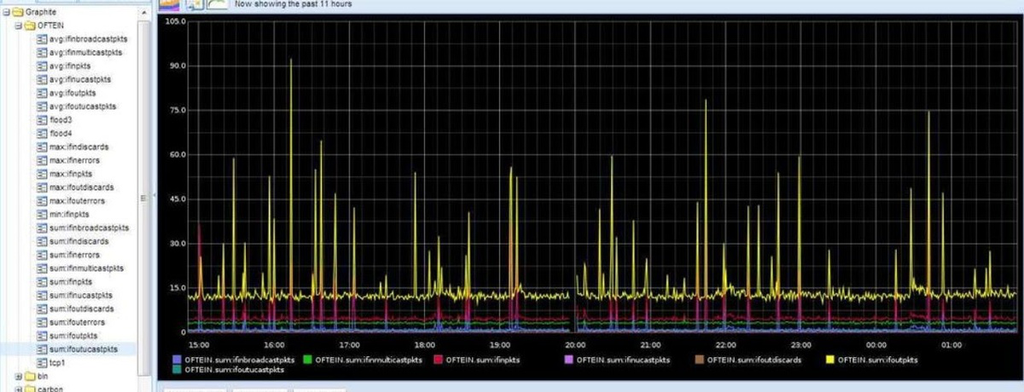
In the case of the Graphite Web UI, this tool’s functionality is almost completely eclipsed by Grafana. A basic Graphite Web UI dashboard look like this:
In the case of Prometheus, the Expression Browser still has some useful functionality that Grafana doesn’t have. Primarily, the Expression Browser is still useful for performing in-depth querying into the metrics being stored. While Grafana is good for displaying metrics that you are watching over a long period of time, the expression browser is great as an exploration console, allowing you to query into your database and find out the answers to your questions. The Expression Browser looks like this:

Further resources
Our article Prometheus or Graphite - Which should I choose? goes into more depth on this subject. This article outlines deeper differences in the Prometheus and Graphite architecture, as well as the differences in user experience. It also has a great list of reasons why you should choose one over the other.
To try out both Hosted Graphite and Hosted Prometheus, sign up for our 14-day free trial. You can send metrics into our platform and visualize your data with Grafana within a few minutes. If you have any questions, book a demo and talk to us directly about how MetricFire can improve your monitoring.
Get similar stories in your inbox weekly, for free
Share this story:

MetricFire
MetricFire provides a complete infrastructure and application monitoring platform from a suite of open source monitoring tools. Depending on your setup, choose Hosted Prometheus or Graphite and view your metrics on beautiful Grafana dashboards in real-time.
Published by
MetricFire provides a complete infrastructure and application monitoring platform from a suite of open source monitoring tools. Depending on your setup, choose Hosted Prometheus or Graphite and view your metrics on beautiful Grafana dashboards in real-time.

Latest stories

Best Cloud Hosting in the USA
This article explores five notable cloud hosting offers in the USA in a detailed way.

Best Dedicated Hosting in the USA
In this article, we explore 5 of the best dedicated hosting providers in the USA: …


The best tools for bare metal automation that people actually use
Bare metal automation turns slow, error-prone server installs into repeatable, API-driven workflows by combining provisioning, …

HIPAA and PCI DSS Hosting for SMBs: How to Choose the Right Provider
HIPAA protects patient data; PCI DSS protects payment data. Many small and mid-sized businesses now …

The Rise of GPUOps: Where Infrastructure Meets Thermodynamics
GPUs used to be a line item. Now they're the heartbeat of modern infrastructure.

Top Bare-Metal Hosting Providers in the USA
In a cloud-first world, certain workloads still require full control over hardware. High-performance computing, latency-sensitive …

Top 8 Cloud GPU Providers for AI and Machine Learning
As AI and machine learning workloads grow in complexity and scale, the need for powerful, …

How ManageEngine Applications Manager Can Help Overcome Challenges In Kubernetes Monitoring
We tested ManageEngine Applications Manager to monitor different Kubernetes clusters. This post shares our review …

AIOps with Site24x7: Maximizing Efficiency at an Affordable Cost
In this post we'll dive deep into integrating AIOps in your business suing Site24x7 to …

A Review of Zoho ManageEngine
Zoho Corp., formerly known as AdventNet Inc., has established itself as a major player in …
