How to Monitor a Heroku App with Graphite, Grafana and StatsD
in Containerization , Visualization , Monitoring and Observability

Today, we will be monitoring a Heroku App using MetricFire’s Heroku Plugin called HostedGraphite. On top of app metrics, we will also add StatsD to our Heroku App.
Today, we will be monitoring a Heroku App using MetricFire’s Heroku Plugin called HostedGraphite. On top of app metrics, we will also add StatsD to our Heroku App. We then will consolidate all those metrics onto our MetricFire’s Grafana dashboards. This will let us track and gauge our Heroku’s app resources and also the stats that we specify in code. Our end result will look something like the image above.
Prerequisites
We will only be going over the setup process of MetricFire on our Heroku App, this assumes that you already have a Heroku App running along with the Heroku CLI. You can check out our StatsD article if you’re not familiar with StatsD, as we will not be showing how to set up StatsD in this article. For using Grafana, you can check out our article on Grafana dashboards, from basic to advanced.
MetricFire
First we will need a MetricFire account to get our API key for Heroku, you can get a 14-day free trial in just a few minutes. Once you are logged in, we will go to Add-Ons > Add-Ons > Heroku, like in the image below.

MetricFire is pretty good at saving you time, they’ve already laid out the command that we need to run. You can see where to copy it in the image below.

Note that the command requires you to enter your app name correctly, just replace <app_name> with your Heroku’s app name when we run this command later.
Setting up Heroku Add-On
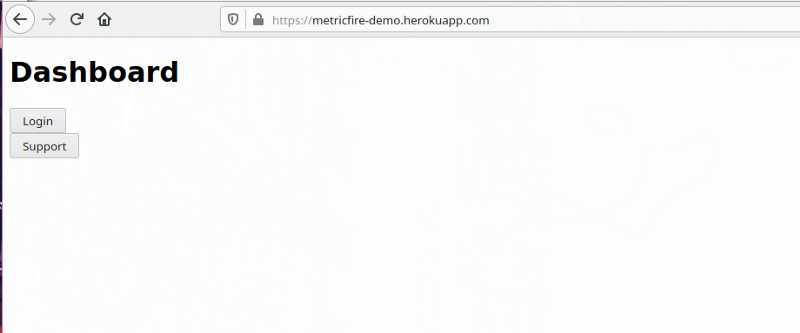
My simple Heroku app is running on Django. The code will be in Python, but you can apply the same concepts to any other framework in a different language. Here’s a quick overview of my app:


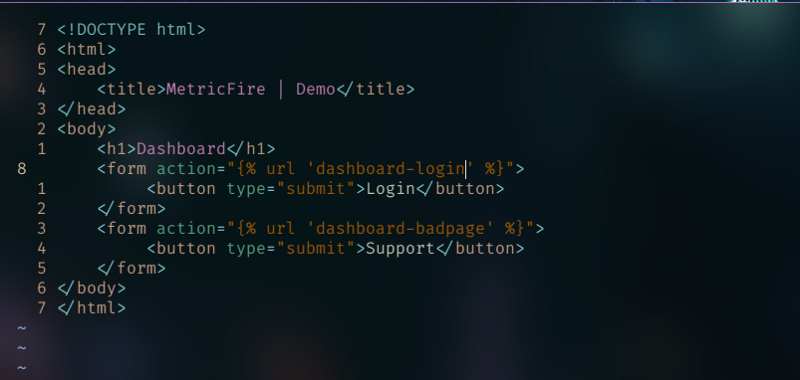
The layout should be simple enough to follow, and the image below is what it looks like on Heroku.
Now let’s activate our Heroku Add-On with that command we got earlier from our MetricFire account. You can see the output in the image below.

Next we need to add our API key into our environment variables in Heroku. The key name will be HOSTEDGRAPHITE_APIKEY, you can also check the image below for the output. Run heroku config:set HOSTEDGRAPHITE_APIKEY=YOUR_API_KEY.

Now our Heroku app should be sending metrics to our MetricFire account. Let’s confirm those metrics from our Metric Treemap. From our dashboard, we go to Metrics > Metric Treemap like in the image below.

We can see that there is a Heroku section in the Treemap, which means our add-on on Heroku is working. Before setting up our Grafana graph, let’s add StatsD on our app to track which button is being pressed at what time.
Implementing StatsD
StatsD is implemented by adding code to our app’s code. You can refer to the images above labeled “View: dashboard/views.py” and compare it with the image below to see where the StatsD code has been added.

We are only going to add count metrics to our login and “support” buttons. As you can see in the image above, our support_button is actually leading to a bad page. This is to replicate a failure in a button, which will show up on our graph later.
Let’s test our StatsD metrics by pressing those buttons on our app. After clicking those buttons, let’s check out our Heroku logs to see if they actually did something.

As you can see in the image above, our login button gives us a 200 response, and our “support” button gives us a 404 response. This is as expected from what we intended to set up. Next, we will check if those StatsD stats went to our MetricFire account. Go back to our MetricFire dashboard > Metrics > Metrics Treemap, and look for the “counters” box.

We can see that our login and support buttons are now sending StatsD metrics to our MetricFire account. Now that we have all the metrics we need, let’s set up our Grafana dashboard on MetricFire.
Setting up a Grafana Dashboard on MetricFire
Let’s add a new dashboard to Grafana on our MetricFire account. There are a few useful metrics to track. First we will visualize the amount of 404 responses we get, like in the image below.

Next we will visualize the amount of services and the amount of bytes used, like in the image below. Play around with the functions you can use to transform your metrics to produce a graph you’ll like.

Next we will add our StatsD metrics onto our 404 panel. This is because we want to track the buttons we have on our page, and see which ones give a bad response. Check the image below on querying the StatsD metrics on our 404 panel.

I have changed the visualizations to show bars: green are 404s, yellow is the login button, and blue is the support button. If our simple app was actually a site that is frequently used, we can now correlate which button is failing just by looking at the colors of the bars. Play around with the metrics, functions, and visualizations to create a dashboard that will be useful for maintenance and debugging.

If you’re interested in trying it out, get on to the MetricFire free trial and start sending metrics from your Heroku app. Also, reach out to us by booking a demo, and we can talk further about the monitoring you need for your company.
Get similar stories in your inbox weekly, for free
Share this story:

MetricFire
MetricFire provides a complete infrastructure and application monitoring platform from a suite of open source monitoring tools. Depending on your setup, choose Hosted Prometheus or Graphite and view your metrics on beautiful Grafana dashboards in real-time.
Published by
MetricFire provides a complete infrastructure and application monitoring platform from a suite of open source monitoring tools. Depending on your setup, choose Hosted Prometheus or Graphite and view your metrics on beautiful Grafana dashboards in real-time.

Latest stories

Best Cloud Hosting in the USA
This article explores five notable cloud hosting offers in the USA in a detailed way.

Best Dedicated Hosting in the USA
In this article, we explore 5 of the best dedicated hosting providers in the USA: …


The best tools for bare metal automation that people actually use
Bare metal automation turns slow, error-prone server installs into repeatable, API-driven workflows by combining provisioning, …

HIPAA and PCI DSS Hosting for SMBs: How to Choose the Right Provider
HIPAA protects patient data; PCI DSS protects payment data. Many small and mid-sized businesses now …

The Rise of GPUOps: Where Infrastructure Meets Thermodynamics
GPUs used to be a line item. Now they're the heartbeat of modern infrastructure.

Top Bare-Metal Hosting Providers in the USA
In a cloud-first world, certain workloads still require full control over hardware. High-performance computing, latency-sensitive …

Top 8 Cloud GPU Providers for AI and Machine Learning
As AI and machine learning workloads grow in complexity and scale, the need for powerful, …

How ManageEngine Applications Manager Can Help Overcome Challenges In Kubernetes Monitoring
We tested ManageEngine Applications Manager to monitor different Kubernetes clusters. This post shares our review …

AIOps with Site24x7: Maximizing Efficiency at an Affordable Cost
In this post we'll dive deep into integrating AIOps in your business suing Site24x7 to …

A Review of Zoho ManageEngine
Zoho Corp., formerly known as AdventNet Inc., has established itself as a major player in …
