A Modern Guide to MySQL Performance Monitoring

According to results from the Stack Overflow Developer Survey 2020, more than half (55%) of respondents say they use MySQL, making it the most widely-adopted database technology among developers today. This popularity is due in no small part to MySQL’s unique features that help it handily meet the needs of modern applications, from small software projects to business-critical systems.
As use cases continue to grow more complex and consume larger volumes of data, monitoring performance plays an even more important role in managing MySQL databases. Keeping a close eye on performance helps ensure that your application takes full advantage of the high degree of flexibility, scalability, availability, reliability, and security that MySQL offers.
This article gives a detailed introduction and guide to MySQL performance monitoring. It explains key concepts about monitoring MySQL databases, crucial performance metrics to track, as well as steps and tools to include in an effective monitoring strategy.
Tools like MetricFire make MySQL performance monitoring simpler and more efficient. MetricFire is a full-featured monitoring and observability platform that’s ideal for keeping track of MySQL database performance. With MetricFire, you don’t need to manage and store time-series metrics yourself. Instead, MetricFire pulls the performance data into a hosted timescale database and uses it to generate customizable reports and dashboards.
Find out more about how MetricFire improves your MySQL monitoring process with a quick demo, or get started with the MetricFire free trial today.
Understanding MySQL performance
MySQL serves as the backbone of many of today’s web, mobile, desktop, and cloud applications. It was built with a strong focus on speed and reliability right from the outset. That’s why one of MySQL’s main selling points is that it’s a highly-performant database system.
A brief MySQL overview
The official MySQL Reference Manual describes MySQL as a fast and stable multi-user, multi-threaded open-source relational database management system (RDBMS). First released in 1995, MySQL now comes in two separate editions: the freely-available MySQL Community Server and the commercial MySQL Enterprise Edition.
MySQL supports essential features such as flexible architecture (open-source, multi-threaded, pluggable storage engine), compatibility with ANSI SQL standards, high availability and replication (built-in replication engines, global transaction IDs, sharding, etc.), OLTP and transactions (ACID compliance, referential integrity, row-level locking, etc.), database security, and high performance.
These features make MySQL the ideal database back-end for applications that rely on distributed operations, websites, and web apps that need to ship quickly, and systems that need to rapidly scale on demand.
MySQL features that impact database performance
Compared to other full-featured relational databases like PostgreSQL, MySQL offers a relatively lighter set of features, so that it is able to deliver better speed and reliability.
The MySQL technical specifications include the following items that drive database performance:
- Resource groups (used for assigning threads and allocating resources)
- Partitioning
- Optimized for high concurrency
- Optimized for read-only
- Optimized for SSD
- Multiple index types (B-tree, R-tree, hash, full text, etc.)
- Server-side thread pool
- Connection thread caching
- Diagnostics and SQL tracing
- Performance schema and sys schema
With these built-in performance-focused features, MySQL continues to enjoy a reputation for being a fast and reliable database solution, even as other RDBMS options start to match MySQL’s performance under newer benchmark testing.
Why do MySQL performance monitoring
Your database forms a critical layer in the application stack. Everything in your app or website that’s built on top of that layer will depend on how well the database performs.
Monitoring database performance helps you preemptively handle possible problems in your application before they affect end users. But aside from helping you prevent and fix issues, data monitoring also lets you:
- Identify opportunities for database optimization (such as rewriting sub-optimal queries)
- Determine the impact of changes (such as data migrations, changing schema definitions, modifying the configuration, shipping new features, etc.)
- Provision server and compute resources according to actual requirements (horizontal scaling)
- Pinpoint potential security vulnerabilities and apply adequate security measures
- Discover areas for growth and improvement in user experience
In short, monitoring MySQL performance cuts across all critical levels of your app or website, not just the database itself.
Key MySQL database performance metrics
Before we jump into the different MySQL performance metrics to track, let’s first unpack what it means to measure database performance. After all, that’s what we’re essentially doing when we monitor metrics: we’re measuring specific activities and recording these measurements.
Measuring MySQL database performance
In general, database performance metrics broadly fall into two main types: workload metrics and resource metrics. Workload metrics measure the overall performance of a database by gauging the amount of work or output it can produce in a given period. Resource metrics, meanwhile, measure how much hardware, software, and network resources a database consumes to function.
Both workload and resource metrics are further composed of different performance subcategories. For most use cases, the most important categories are:
- Throughput: Workload metrics that gauge how much work a database performs in a given time interval (e.g. number of queries, transactions, reads, writes, etc.)
- Latency (Execution Time): Workload metrics that measure the time it takes for a database to perform a given unit of work (e.g., query run times)
- Connections (Concurrency): Resource metrics that tell you the number of queries running concurrently and unable to complete in time (e.g., number of connected threads, running threads, aborted connections, etc.)
- Buffer (Utilization): Resource metrics that gauge buffer (cache) usage (e.g., buffer pool utilization)
Later on, we’ll take a look at some key statistics to monitor under each of these categories.
Locating MySQL performance metrics
MySQL performance monitoring metrics can be queried from three different locations: server status variables, sys schema, and performance schema.
- Server status variables: These are internal “counters” that MySQL maintains in order to provide information about its operation. These variables include Questions, Slow_queries, Threads_running, Com_select and others (see a full list of server status variables here).
- Performance schema: This is a MySQL feature for monitoring MySQL Server events and query execution. Performance metrics are obtained by querying one or more tables in the performance_schema database such as the events_statements_summary_by_digest table.
- Sys schema: The MySQL sys schema improves the usability of the performance schema (which, with dozens of tables, can sometimes be tedious to work with). The schema includes views, functions, and procedures which make it more convenient to analyze data collected by the performance schema.
We’ll see usage examples for each of these three features shortly.
Choosing which performance metrics to monitor
With potentially hundreds of performance metrics available to monitor for your MySQL database, which statistics should you keep an eye on? Although it can vary from one use case to another, here’s a list of some of the critical metrics to track in each of the four key database performance categories:
- Throughput: -Questions: the number of client-initiated statements executed by the server
- Queries: the number of statements executed by the server (includes both client-sent statements and statements executed in stored procedures)
- Com_select: counts how many SELECT statements were executed, indicates the level of read-only activity
- Com_insert, Com_update, and Com_delete: indicate the level of write operations, usually summed up into a single variable
- Latency:
- Slow_Queries: the number of queries that exceed long_query_time seconds to execute
- Query run time: statistics about how long queries took to execute, available in the performance schema
- Concurrency:
- Aborted_connects: counts how many attempts failed to connect to the MySQL server
- Threads_connected: the number of connections currently open
- Threads_running: counts how many threads that are not sleeping
- Buffers:
- Statistics that result from running the statement SHOW ENGINE INNODB STATUS
Please note that, unless otherwise indicated, the above metrics can be obtained by querying built-in server status variables. The descriptions are also taken from MySQL’s official documentation.
Collecting and monitoring MySQL performance metrics
In the previous section, we’ve seen what types of performance metrics to monitor in your MySQL database. We’ll now take a look at a number of ways and tools to collect the data we need.
Server status variables
We learned that MySQL keeps track of “counters” called server-status variables. Server status variables give you information about MySQL’s operations. The total number of server status variables varies depending on the version of MySQL Server being used.
These variables can be accessed using the SHOW [GLOBAL | SESSION] STATUS statement. With GLOBAL, the statement returns aggregated values across all connections, while SESSION limits the values to only the current connection.
For example, the following statement displays all server status variables and their values across all connections:
mysql> SHOW GLOBAL STATUS;| Variable_name | Value |
+-------------------------------------------------------+-------------------------------------------------------------------------------------------------------------------------------------------------------------------------------------------------------------------------------------------------------------------------------------------------------------------------------------------------------------------------------------------------------------------------------------------------------------------------------------------------------------------------------------------------------------------------------------------------------------------------------------------------------------------------------------------------------------------------------------------+
| Aborted_clients | 0 |
| Aborted_connects | 3 |
| Acl_cache_items_count | 0 |
| Binlog_cache_disk_use | 11 |
| Binlog_cache_use | 60 |
| Binlog_stmt_cache_disk_use | 0 |
| Binlog_stmt_cache_use | 8 |
| Bytes_received | 3843055 |
| Bytes_sent | 214977 |
...
| Threads_cached | 1 |
| Threads_connected | 3 |
| Threads_created | 4 |
| Threads_running | 2 |
| Uptime | 6086 |
| Uptime_since_flush_status | 6086 |
+-------------------------------------------------------+-------------------------------------------------------------------------------------------------------------------------------------------------------------------------------------------------------------------------------------------------------------------------------------------------------------------------------------------------------------------------------------------------------------------------------------------------------------------------------------------------------------------------------------------------------------------------------------------------------------------------------------------------------------------------------------------------------------------------------------------+
463 rows in set (0.0047 sec)You can also view a single server status variable by:
mysql> SHOW STATUS LIKE '%Com_select%';+---------------+-------+
| Variable_name | Value |
+---------------+-------+
| Com_select | 10 |
+---------------+-------+
1 row in set (0.0130 sec)The preceding section mentioned a few important server status variables such as Questions, Queries, Com_insert, Com_update, etc. For a full list of available variables, check the documentation for your version of MySQL Server.
Performance schema
The MySQL performance schema monitors server execution at the individual query level. In a MySQL Server that supports the performance schema, it’s available as a database named performance_schema which contains tables that can be queried with the usual SELECT statements. Before you can start querying the performance schema, you first need to make sure that it’s properly installed and enabled.
The performance_schema database groups its tables based on the type of information they contain: Current events, event histories and summaries, object instances, and setup (configuration) information. To view all the available tables in the performance_schema, run the following statement:
mysql> SELECT TABLE_NAME FROM INFORMATION_SCHEMA.TABLES
       WHERE TABLE_SCHEMA = 'performance_schema';
+------------------------------------------------------+
| TABLE_NAME |
+------------------------------------------------------+
| accounts |
| cond_instances |
| data_lock_waits |
| data_locks |
| events_errors_summary_by_account_by_error |
| events_errors_summary_by_host_by_error |
| events_errors_summary_by_thread_by_error |
...
| table_handles |
| table_io_waits_summary_by_index_usage |
| table_io_waits_summary_by_table |
| table_lock_waits_summary_by_table |
| threads |
| user_defined_functions |
| user_variables_by_thread |
| users |
| variables_by_thread |
| variables_info |
+------------------------------------------------------+
103 rows in set (0.1040 sec)Earlier, we noted that key performance statistics can be found by querying a number of tables in the performance_schema database, specifically the events_statements_summary_by_digest table.
The below statement returns the query with the longest execution time:
mysql> SELECT digest_text, avg_timer_wait
       FROM performance_schema.events_statements_summary_by_digest
       ORDER BY avg_timer_wait DESC
       LIMIT 1;
+-----------------------------------------------+----------------+
| digest_text | avg_timer_wait |
+-----------------------------------------------+----------------+
| INSERT INTO `rental` VALUES (...) /* , ... */ | 407201600000 |
+-----------------------------------------------+----------------+
1 row in set (0.0052 sec)Please note that you can avoid using the performance_schema schema name in the above statement by setting performance_schema as the current database with USE performance_schema.
Sys schema
Even with our fairly simple example above, it’s not hard to imagine that querying the performance schema can get tedious with more complex use cases. That’s why MySQL introduced the sys schema as a feature starting in version 5.7.7.
The sys schema provides views, stored procedures, and stored functions that make it easier to access the information contained in the performance_schema database tables.
Using the example from the official sys schema documentation, we see this in action with the host_summary_by_file_io view which summarizes file I/O grouped by host and displays more readable values of latency:
mysql> SELECT * FROM sys.host_summary_by_file_io;+------------+-------+------------+
| host | ios | io_latency |
+------------+-------+------------+
| background | 12167 | 1.48 s |
| localhost | 1694 | 427.99 ms |
+------------+-------+------------+
2 rows in set (0.0049 sec)MySQL Workbench
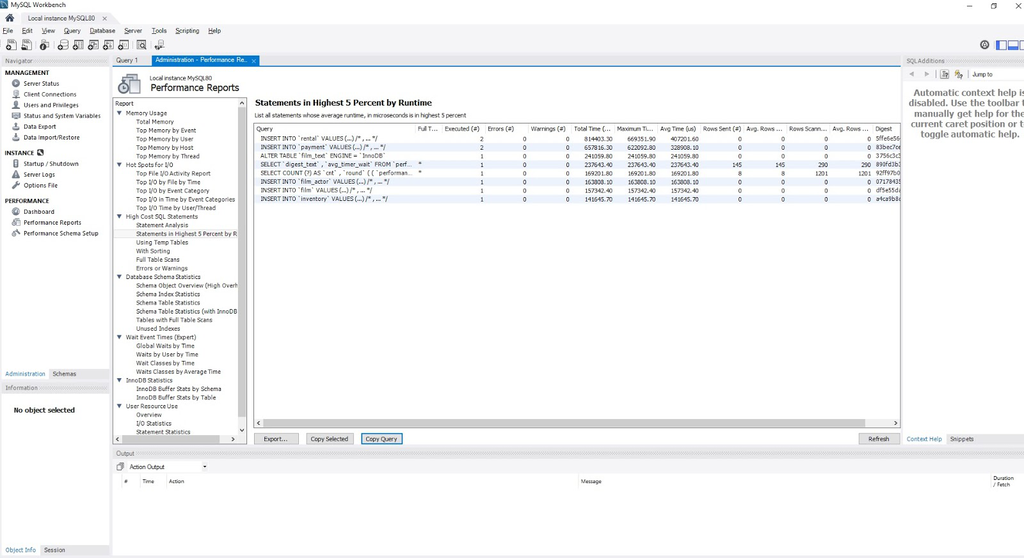
A more convenient approach at exploring and investigating database performance that’s also supported by MySQL is to use the Workbench GUI. MySQL Workbench provides a visual way to design, manage, and monitor MySQL databases.

In addition to a built-in dashboard that displays high-level stats, MySQL Workbench also lets you quickly drill down on performance metrics contained in the sys schema:
Full-featured monitoring tools
The monitoring features that MySQL provides out of the box work well for quick, one-time checks. But when you need continuous real-time monitoring of a production database, these built-in features and basic functionalities simply won’t be enough.
This is where you need to use a full-featured database monitoring tool. These platforms integrate with MySQL to manage the collection, storage, and retrieval of performance metrics, allowing you to:
- Offload the task of monitoring and storing performance data to an external service so that your database resources stay focused exclusively on serving the application
- Analyze and visualize database performance at different levels of granularity
- Set up alerts and notifications for different events and triggers
- Track performance continuously even in high-volume production environments
MetricFire is an example of a robust, full-featured monitoring platform that helps you keep track of database performance continuously, in real-time. As an external tool, MetricFire is easy to set up and integrate with your MySQL Server. Once plugged in, MetricFire does the legwork of collecting and storing time-series data, providing you with custom visualization/reporting, proactive alerting, and fully-managed support.
One key MetricFire feature that simplifies MySQL monitoring is its out-of-the-box support for the Hosted Graphite Agent (HG-Agent). The Hosted Graphite Agent is a monitoring application built on top of the Diamond metrics collection tool and Supervisor process manager. It only requires a quick install process to get up and running, and it then automatically monitors the server it's running on without the need for added configuration or setup. Once installed, the HG-Agent collects system metrics and publishes them to Hosted Graphite, where the time-series data is stored, processed, and visualized. With MetricFire's Hosted Graphite Agent client, HG-Agent installation and setup become even quicker.
Learn more by booking a demo today, or start using MetricFire for free.
Conclusion
In this post, we went over the essential things you need to know in order to effectively monitor MySQL databases. We learned what features make MySQL a fast and reliable RDBMS, how database performance is measured in MySQL, which performance metrics to track, and how to use various features and tools to monitor performance.
With these concepts in mind, you’re now ready to put together a solid monitoring strategy. Your plan should include choosing the right monitoring tool that meets your requirements. By combining hosted Prometheus, Graphite, and Grafana in a full-featured monitoring platform, MetricFire can be the right tool for your MySQL monitoring needs. Book a demo to find out more or sign up for a free trial to get started with MetricFire today.
Get similar stories in your inbox weekly, for free
Share this story:

MetricFire
MetricFire provides a complete infrastructure and application monitoring platform from a suite of open source monitoring tools. Depending on your setup, choose Hosted Prometheus or Graphite and view your metrics on beautiful Grafana dashboards in real-time.
Published by
MetricFire provides a complete infrastructure and application monitoring platform from a suite of open source monitoring tools. Depending on your setup, choose Hosted Prometheus or Graphite and view your metrics on beautiful Grafana dashboards in real-time.

Latest stories

Best Cloud Hosting in the USA
This article explores five notable cloud hosting offers in the USA in a detailed way.

Best Dedicated Hosting in the USA
In this article, we explore 5 of the best dedicated hosting providers in the USA: …


The best tools for bare metal automation that people actually use
Bare metal automation turns slow, error-prone server installs into repeatable, API-driven workflows by combining provisioning, …

HIPAA and PCI DSS Hosting for SMBs: How to Choose the Right Provider
HIPAA protects patient data; PCI DSS protects payment data. Many small and mid-sized businesses now …

The Rise of GPUOps: Where Infrastructure Meets Thermodynamics
GPUs used to be a line item. Now they're the heartbeat of modern infrastructure.

Top Bare-Metal Hosting Providers in the USA
In a cloud-first world, certain workloads still require full control over hardware. High-performance computing, latency-sensitive …

Top 8 Cloud GPU Providers for AI and Machine Learning
As AI and machine learning workloads grow in complexity and scale, the need for powerful, …

How ManageEngine Applications Manager Can Help Overcome Challenges In Kubernetes Monitoring
We tested ManageEngine Applications Manager to monitor different Kubernetes clusters. This post shares our review …

AIOps with Site24x7: Maximizing Efficiency at an Affordable Cost
In this post we'll dive deep into integrating AIOps in your business suing Site24x7 to …

A Review of Zoho ManageEngine
Zoho Corp., formerly known as AdventNet Inc., has established itself as a major player in …
