Monitoring Kubernetes with Graphite
In this article, we will be covering how to monitor Kubernetes using Graphite, and we’ll do the visualization with Grafana. The focus will be on monitoring and plotting essential metrics for monitoring Kubernetes clusters.
We will download, implement and monitor with the custom dashboards for Kubernetes that can be downloaded from the Grafana dashboard resources. These monitoring dashboards have variables to allow drilling down into data at granular level.
To follow along with this blog, sign up for the MetricFire free trial, where you can use Graphite and Grafana directly in our platform. MetricFire is a hosted Graphite, Grafana and Prometheus service, where we do the setup and management of these open-source tools so you don’t have to.
Introduction to Kubernetes
According to Kubernetes, Kubernetes is a “portable, extensible, open-source platform for managing containerized workloads and services, that facilitates both declarative configuration and automation. It has a large, rapidly growing ecosystem. Kubernetes services, support, and tools are widely available.”
In today’s industry, monitoring Kubernetes deployments is a challenging but necessary activity. In this article, we are not going to cover Kubernetes basics, as we’ll jump more into how to use the dashboards. For a more detailed introduction to Kubernetes monitoring, refer to our Introduction to Monitoring Kubernetes on the MetricFire blog.
Introduction to Graphite
Graphite is a very popular enterprise monitoring tool, and here at MetricFire we have a Hosted Graphite product that has been developing and improving since 2012. Graphite is a time-series monitoring tool that receives metrics data pushed to it by a collector such as StatsD or collectd, and then monitors the time-series metrics as specified by the user. If you’re interested to learn about the basics of Graphite, check out our articles on the Architecture and Concepts and the Installation and Setup of Graphite before reading this article.
Setting up Graphite, Grafana and Kubernetes
For the purpose of this article, we will use a Kubernetes cluster deployed on AWS. Follow the instructions on the Amazon AWS EKS user guide to install AWS CLI, and make sure you also install the kubectl command line tool.
Once the kubectl is installed, running the command “kubectl cluster-info” should give the following output:
~ ./kubectl cluster-info
Kubernetes master is running at https://92797800687320683968AF0937C2B5D3.yl4.ap-south-1.eks.amazonaws.com
CoreDNS is running at https://92797800687320683968AF0937C2B5D3.yl4.ap-south-1.eks.amazonaws.com/api/v1/namespaces/kube-system/services/kube-dns:dns/proxy
Next, let’s set up Grafana on our kubernetes cluster. Here is the simple configuration file which will create a Grafana Pod and a Service running on Kubernetes:
apiVersion: apps/v1
kind: Deployment
metadata:
 labels:
   app: grafana
 name: grafana
spec:
 replicas: 1
 selector:
   matchLabels:
     app: grafana
 template:
   metadata:
     labels:
       app: grafana
   spec:
     containers:
     - image: grafana/grafana:5.4.3
       name: grafana
       ports:
       - containerPort: 3000
         name: http

       volumeMounts:
         - name: grafana-storage
           mountPath: /var/lib/grafana
     volumes:
       - name: grafana-storage
         persistentVolumeClaim:
           claimName: grafana-storage
     securityContext:
       runAsNonRoot: true
       runAsUser: 65534
       fsGroup: 472
---
kind: PersistentVolumeClaim
apiVersion: v1
metadata:
 name: grafana-storage
spec:
 accessModes:
   - ReadWriteOnce
 resources:
   requests:
     storage: 1Gi
---
apiVersion: v1
kind: Service
metadata:
 name: grafana
 labels:
   app: grafana
spec:
 type: LoadBalancer
 ports:
 - port: 3000
   protocol: TCP
   targetPort: 3000
 selector:
   app: grafana
Run, “kubectl create -f grafana-deployment.yml” to create Grafana Pod and Service.
If we run the command “kubectl get service”, you should get an output similar to below:
➜  ~/github/k8-graphite-monitoring (master) kubectl get service
NAME         TYPE           CLUSTER-IP       EXTERNAL-IP                                                                PORT(S)                       AGE
grafana      LoadBalancer   10.100.252.229   a942a31a4780f11eaa9010a814a720da-1449083553.ap-south-1.elb.amazonaws.com   3000:31159/TCP                3d21h
kubernetes   ClusterIP      10.100.0.1       <none>                                                                     443/TCP
➜ ~/github/k8-graphite-monitoring (master) kubectl get service NAME TYPE CLUSTER-IP EXTERNAL-IP PORT(S) AGE grafana LoadBalancer 10.100.252.229 a942a31a4780f11eaa9010a814a720da-1449083553.ap-south-1.elb.amazonaws.com 3000:31159/TCP 3d21h kubernetes ClusterIP 10.100.0.1 <none> 443/TCP

apiVersion: apps/v1
kind: Deployment
metadata:
 labels:
   app: graphite
 name: graphite
spec:
 replicas: 1
 selector:
   matchLabels:
     app: graphite
 template:
   metadata:
     labels:
       app: graphite
   spec:
     containers:
     - image: graphiteapp/graphite-statsd
       name: graphite
       ports:
       - containerPort: 2003
         name: carbon-plain
       - containerPort: 2004
         name: carbon-pkl
       - containerPort: 2023
         name: carbon-ag-plain
       - containerPort: 2024
         name: carbon-ag-pkl
       - containerPort: 8125
         name: statsd
       - containerPort: 8126
         name: statsd-admin
       - containerPort: 80
         name: http
---
apiVersion: v1
kind: Service
metadata:
 name: graphite
 labels:
   app: graphite
spec:
 type: LoadBalancer
 ports:
 - port: 80
   protocol: TCP
   targetPort: 80
   name: http
 - port: 2003
   protocol: TCP
   targetPort: 2003
   name: carbon
 selector:
   app: graphite
Run, “kubectl create -f graphite-deployment.yml” to create this Pod and Service.
At this point, both Grafana and Graphite, should be up and running.
Run, “kubectl get service” to make sure both the services are up and running.
➜ ~/github/k8-graphite-monitoring (master) kubectl get service
NAME TYPE CLUSTER-IP EXTERNAL-IP PORT(S) AGE
grafana LoadBalancer 10.100.252.229 a942a31a4780f11eaa9010a814a720da-1449083553.ap-south-1.elb.amazonaws.com 3000:31159/TCP 3d21h
graphite LoadBalancer 10.100.216.91 ac0f466207b2211eaa9010a814a720da-687823427.ap-south-1.elb.amazonaws.com 80:32198/TCP,2003:32041/TCP 104s
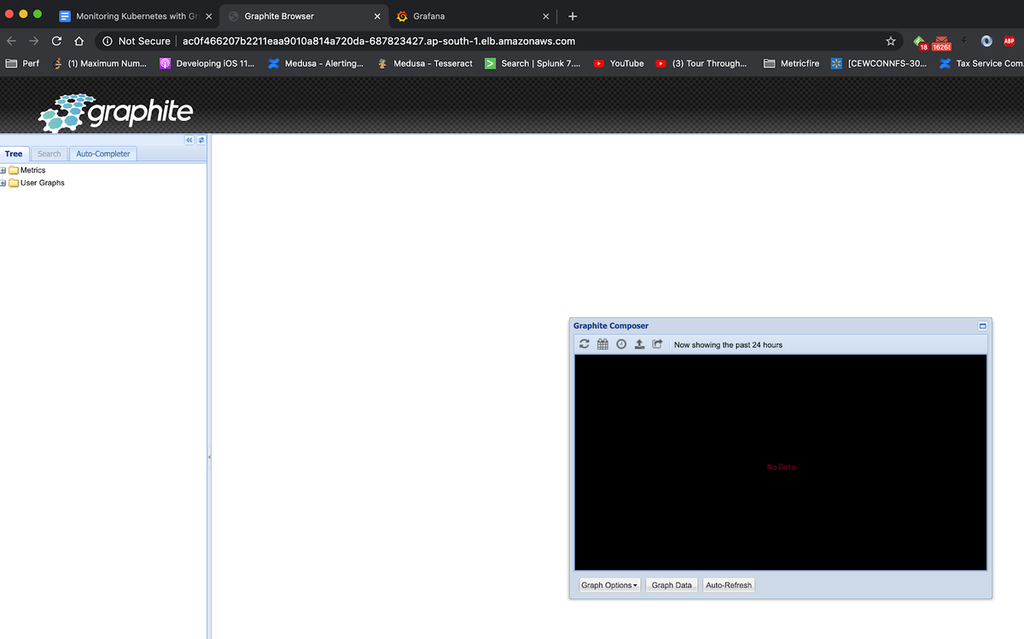
kubernetes ClusterIP 10.100.0.1 <none> 443/TCP 3d22hJust like Grafana, we can enter http://ac0f466207b2211eaa9010a814a720da-687823427.ap-south-1.elb.amazonaws.com in the browser to open the Graphite web application, as shown below:
Now, we will add Graphite as the data source in Grafana. Browse to the data source section of Grafana and add Graphite as the data source, as shown below:

Now, we will run Snap Daemon in our Kubernetes cluster. Snap Daemon is the monitoring daemon which will pull various kubernetes monitoring metrics and push them into Graphite.
Before we run the Snap Daemon, we need to make one small change inside snap_ds.yml. We will update the hostname and port of Graphite service in the config section as shown below:
apiVersion: apps/v1
kind: DaemonSet
metadata:
 name: snap
spec:
 selector:
   matchLabels:
     name: snap
 template:
   metadata:
     name: snap
     labels:
       name: snap
   spec:
     hostPID: true
     hostNetwork: true
     containers:
     - name: snap
       image: raintank/snap_k8s:v4
       volumeMounts:
         - mountPath: /sys/fs/cgroup
           name: cgroup
         - mountPath: /var/run/docker.sock
           name: docker-sock
         - mountPath: /var/lib/docker
           name: fs-stats
         - mountPath: /usr/local/bin/docker
           name: docker
         - mountPath: /proc_host
           name: proc
         - mountPath: /opt/snap/tasks
           name: snap-tasks
       ports:
       - containerPort: 8181
         hostPort: 8181
         name: snap-api
       imagePullPolicy: IfNotPresent
       securityContext:
         privileged: true
       env:
         - name: PROCFS_MOUNT
           value: /proc_host
     volumes:
       - name: dev
         hostPath:
           path: /dev
       - name: cgroup
         hostPath:
           path: /sys/fs/cgroup
       - name: docker-sock
         hostPath:
           path: /var/run/docker.sock
       - name: fs-stats
         hostPath:
           path: /var/lib/docker
       - name: docker
         hostPath:
           path: /usr/bin/docker
       - name: proc
         hostPath:
           path: /proc
       - name: snap-tasks
         configMap:
           name: snap-tasks
---
apiVersion: v1
kind: ConfigMap
metadata:
 name: snap-tasks
data:
 core.json: |-
   {
       "version": 1,
       "schedule": {
           "type": "simple",
           "interval": "10s"
       },
       "workflow": {
           "collect": {
               "metrics": {
                   "/intel/docker/*":{},
                   "/intel/procfs/cpu/*": {},
                   "/intel/procfs/meminfo/*": {},
                   "/intel/procfs/iface/*": {},
                   "/intel/linux/iostat/*": {},
                   "/intel/procfs/load/*": {}
               },
               "config": {
                   "/intel/procfs": {
                       "proc_path": "/proc_host"
                   }
               },
               "process": null,
               "publish": [
                   {
                       "plugin_name": "graphite",
                       "config": {
                           "prefix": "snap.dev.<%NODE%>",
                           "server": "ac0f466207b2211eaa9010a814a720da-687823427.ap-south-1.elb.amazonaws.com",
                           "port": 2003
                       }
                   }
               ]
           }
       }
   }
Run, “kubectl create -f snap_ds.yml” to create Snap Daemon and get it started. If we now run, “kubectl get pod”, we will see output similar to below:
NAME                       READY   STATUS    RESTARTS   AGE
grafana-6f64b8c7f6-tc7qn   1/1     Running   0          3d23h
graphite-775d8b989-zwp9x   1/1     Running   0          65m
snap-dblx2                 1/1     Running   0          56m
snap-g5pzm                 1/1     Running   0          56m
snap-jdqrg                 1/1     Running   0          56m
We see one Pod for Grafana, one for Graphite and three for Snap. This is because we have 3 nodes in our Kubernetes cluster and Snap will run as a daemon on each of the nodes to pull its metrics and push it to Graphite.
Plotting the monitoring visualization on Grafana
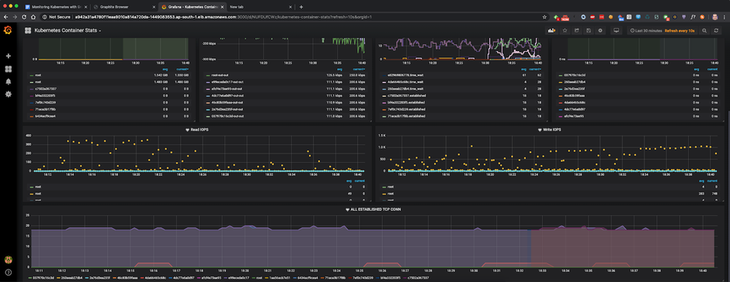
Grafana comes with lots of pre-built dashboards that you can find on the Grafana dashboards resources site. We are going to utilize one of these dashboards for our Kubernetes monitoring: Kubernetes Container Stats
On the Kubernetes Container Stats page, click the link “Download JSON” and import it into our Grafana portal. Make sure to choose the Graphite data source appropriately.

As soon as the dashboard is imported, we should see the metrics being shown in our dashboard, similar to below:


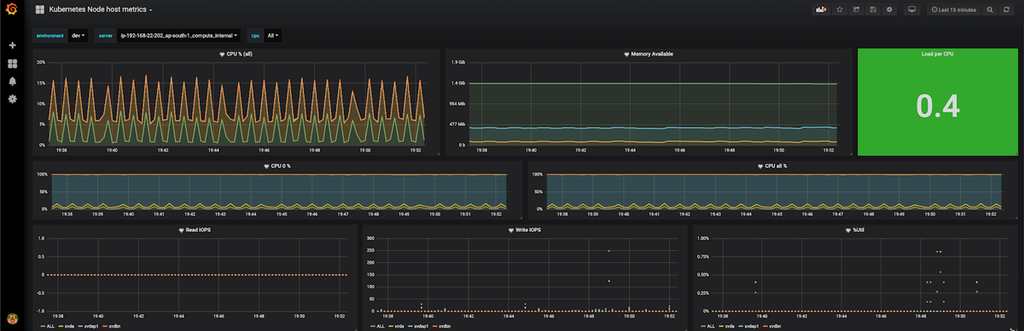
Similarly, there is another dashboard Kubernetes Node host metrics. When this is imported, it will show the metrics per host selected in the dashboard.
You might want to set up alerts on these dashboards if the values in these dashboards exceed some critical threshold. Check out our article Grafana Dashboards from Basic to Advanced to learn how to set up Grafana alerts, and build custom dashboards.
You can also create other types of visualizations based on the metrics exposed by Kubernetes. Have a look at the article Our Favorite Grafana Dashboards to create some of the more advanced dashboards.
Setting up the Monitoring through MetricFire
The setup which we have done above works for very basic Kubernetes infrastructure which would contain just a few nodes. In order to handle production level load, which would be a few hundred nodes and upwards of a few Mbps network traffic, you would need to scale out both Graphite and Grafana to handle the increasing load.
That’s where Hosted Graphite and Hosted Grafana comes into the picture. It allows you to scale for long-term storage, as well as automatically providing redundant storage of data.
Hosted Graphite and Hosted Grafana through MetricFire allows for the continuous active deployment of new features, as MetricFire’s products all have their foundations in the ever-growing open source projects. Sign up for the MetricFire free trial here, and start building Kubernetes dashboards within a few minutes.
Conclusion
In this article, we have seen how to set up Kubernetes monitoring with Graphite. We have seen some advanced visualizations to monitor Kubernetes using Graphite and Grafana.
Sign up here for a free trial of our Hosted Graphite and Grafana offering. Also, if you have any questions about our products, or about how MetricFire can help your company, talk to us directly by booking a demo.
Get similar stories in your inbox weekly, for free
Share this story:

MetricFire
MetricFire provides a complete infrastructure and application monitoring platform from a suite of open source monitoring tools. Depending on your setup, choose Hosted Prometheus or Graphite and view your metrics on beautiful Grafana dashboards in real-time.
Published by
MetricFire provides a complete infrastructure and application monitoring platform from a suite of open source monitoring tools. Depending on your setup, choose Hosted Prometheus or Graphite and view your metrics on beautiful Grafana dashboards in real-time.

Latest stories

Best Cloud Hosting in the USA
This article explores five notable cloud hosting offers in the USA in a detailed way.

Best Dedicated Hosting in the USA
In this article, we explore 5 of the best dedicated hosting providers in the USA: …


The best tools for bare metal automation that people actually use
Bare metal automation turns slow, error-prone server installs into repeatable, API-driven workflows by combining provisioning, …

HIPAA and PCI DSS Hosting for SMBs: How to Choose the Right Provider
HIPAA protects patient data; PCI DSS protects payment data. Many small and mid-sized businesses now …

The Rise of GPUOps: Where Infrastructure Meets Thermodynamics
GPUs used to be a line item. Now they're the heartbeat of modern infrastructure.

Top Bare-Metal Hosting Providers in the USA
In a cloud-first world, certain workloads still require full control over hardware. High-performance computing, latency-sensitive …

Top 8 Cloud GPU Providers for AI and Machine Learning
As AI and machine learning workloads grow in complexity and scale, the need for powerful, …

How ManageEngine Applications Manager Can Help Overcome Challenges In Kubernetes Monitoring
We tested ManageEngine Applications Manager to monitor different Kubernetes clusters. This post shares our review …

AIOps with Site24x7: Maximizing Efficiency at an Affordable Cost
In this post we'll dive deep into integrating AIOps in your business suing Site24x7 to …

A Review of Zoho ManageEngine
Zoho Corp., formerly known as AdventNet Inc., has established itself as a major player in …
