Prometheus Remote Storage

Prometheus can be configured to read from and write to remote storage, in addition to its local time series database. This is intended to support long-term storage of monitoring data.
Remote read
When configured, Prometheus storage queries (e.g. via the HTTP API) are sent to both local and remote storage, and results are merged.

Note that to maintain reliability in the face of remote storage issues, alerting and recording rule evaluation use only the local TSDB.
Configuration
You configure the remote storage read path in the remote_read section of the Prometheus configuration file.
At its simplest, you will just specify the read endpoint URL for your remote storage, plus an authentication method. You can use either HTTP basic or bearer token authentication.
You might want to use the read_recent flag: when set to true, all queries will be answered from remote as well as local storage. When false (the default), any queries that can be answered completely from local storage will not be sent to the remote endpoint.
You can specify a set of required_matchers (label, value pairs) to restrict remote reads to some subset of queries. This is useful if e.g. you write only a subset of your metrics to remote storage (see below).
For more complex configurations, there are also options for request timeouts, TLS configuration, and proxy setup.
You can read from multiple remote endpoints by having one remote_read section for each.
Remote write
When configured, Prometheus forwards its scraped samples to one or more remote stores.
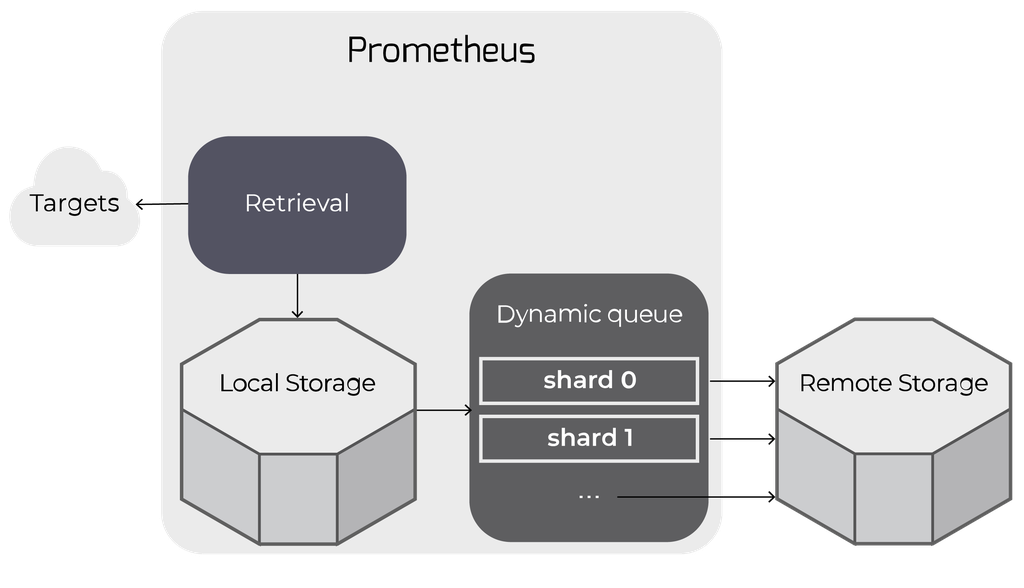
Remote writes work by "tailing" time series samples written to local storage, and queuing them up for write to remote storage.
The queue is actually a dynamically-managed set of "shards": all of the samples for any particular time series (i.e. unique metric) will end up on the same shard.
The queue automatically scales up or down the number of shards writing to remote storage to keep up with the rate of incoming data.
This allows Prometheus to manage remote storage while using only the resources necessary to do so, and with minimal configuration.
Configuration
You configure the remote storage write path in the remote_write section of the Prometheus configuration file.
Like for remote_read, the simplest configuration is just a remote storage write URL, plus an authentication method. You can use either HTTP basic or bearer token authentication.
You can use write_relabel_configs to relabel or restrict the metrics you write to remote storage. For example, a common use is to drop some subset of metrics:
- writeRelabelConfigs:
- # drop all metrics of this name across all jobs
- - sourceLabels: ["__name__"]
- regex: some_metric_prefix_to_drop_.*
- action: drop
The queue_config section gives you some control over the dynamic queue described above. Usually, you won't need to make changes here and can rely on Prometheus' defaults.
capacity: each shard is itself a queue, and this is the number of samples queued before the shard "blocks" further additions;min_shards,max_shards: the minimum & maximum shards the dynamic queue will use;max_samples_per_send,batch_send_deadline: each shard batches samples up into blocks ofmax_samples_per_send, or if it can't make a batch of that size beforebatch_send_deadline, sends anyway; this latter will rarely happen on a busy Prometheus instance;min_backoff,max_backoff,max_retries: retry management; notemax_retriesis not used in the current implementation - each shard will just block and retry sends "forever".
Like for remote_read, you can also configure options for request timeouts, TLS configuration, and proxy setup.
You can write to multiple remote endpoints by having one remote_write section for each.
Log messages
You may see some messages from the remote storage subsystem in your logs:
dropped sample for series that was not explicitly dropped via relabelling
Because of relabelling or for some other reason, we've ended up with a series with no labels in the remote write path; we drop it.Remote storage resharding from N to M
The dynamic queue size is changing the number of shards - either growing to keep up with the number of incoming samples vs. outgoing remote storage write rate, or shrinking because we have more shards than are necessary.Currently resharding, skipping
The dynamic queue wants to change to a new number of shards, but a reshard is already in progress.Failed to flush all samples on shutdown
While shutting down a dynamic queue, Prometheus was unable to flush all samples to remote storage - it's probable there was a problem with the remote storage endpoint.
Metrics
The remote storage subsystem exports lots of metrics, prefixed with prometheus_remote_storage_ or prometheus_wal_watcher_Here's a selection you might find interesting:
prometheus_remote_storage_samples_in_total: Samples in to remote storage, compare to samples out for queue managers (counter);prometheus_remote_storage_succeeded_samples_total: Total number of samples successfully sent to remote storage (counter);prometheus_remote_storage_pending_samples: The number of samples pending in the queue's shards to be sent to the remote storage (gauge);prometheus_remote_storage_shards: The number of shards used for parallel sending to the remote storage (gauge);prometheus_remote_storage_sent_batch_duration_seconds: Duration of sample batch send calls to the remote storage (histogram).
References
- https://prometheus.io/docs/prometheus/latest/configuration/configuration/
The Prometheus configuration file reference, including details notes onremote_readandremote_write; - https://prometheus.io/docs/operating/integrations/#remote-endpoints-and-storage
A list of services & software that offer remote storage endpoints; - Integrating Long-Term Storage with Prometheus - Julius Volz
A detailed presentation on how remote storage works in Prometheus, from CloudNativeCon Europe 2017; - Things you wish you never knew about the Prometheus Remote Write API - Tom Wilkie
Speaker notes on the details of remote_write, from PromCon 2017.
Get similar stories in your inbox weekly, for free
Share this story:

MetricFire
MetricFire provides a complete infrastructure and application monitoring platform from a suite of open source monitoring tools. Depending on your setup, choose Hosted Prometheus or Graphite and view your metrics on beautiful Grafana dashboards in real-time.
Published by
MetricFire provides a complete infrastructure and application monitoring platform from a suite of open source monitoring tools. Depending on your setup, choose Hosted Prometheus or Graphite and view your metrics on beautiful Grafana dashboards in real-time.

Latest stories

Best Cloud Hosting in the USA
This article explores five notable cloud hosting offers in the USA in a detailed way.

Best Dedicated Hosting in the USA
In this article, we explore 5 of the best dedicated hosting providers in the USA: …


The best tools for bare metal automation that people actually use
Bare metal automation turns slow, error-prone server installs into repeatable, API-driven workflows by combining provisioning, …

HIPAA and PCI DSS Hosting for SMBs: How to Choose the Right Provider
HIPAA protects patient data; PCI DSS protects payment data. Many small and mid-sized businesses now …

The Rise of GPUOps: Where Infrastructure Meets Thermodynamics
GPUs used to be a line item. Now they're the heartbeat of modern infrastructure.

Top Bare-Metal Hosting Providers in the USA
In a cloud-first world, certain workloads still require full control over hardware. High-performance computing, latency-sensitive …

Top 8 Cloud GPU Providers for AI and Machine Learning
As AI and machine learning workloads grow in complexity and scale, the need for powerful, …

How ManageEngine Applications Manager Can Help Overcome Challenges In Kubernetes Monitoring
We tested ManageEngine Applications Manager to monitor different Kubernetes clusters. This post shares our review …

AIOps with Site24x7: Maximizing Efficiency at an Affordable Cost
In this post we'll dive deep into integrating AIOps in your business suing Site24x7 to …

A Review of Zoho ManageEngine
Zoho Corp., formerly known as AdventNet Inc., has established itself as a major player in …
