
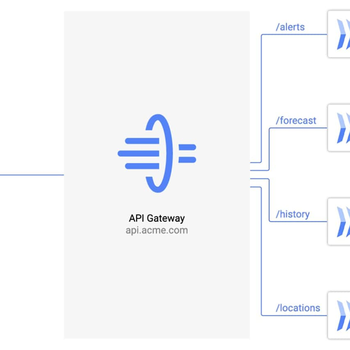

Server monitoring tools: Graphite and alternatives
Graphite is an open-source time-series monitoring software that was first released in 2008. It’s a …
Grafana vs. Kibana
Every organization requires data analysis and monitoring solutions to gain insights into their data. Grafana …

Are you Great at Incident Response?
There are three components to being exceptional during an incident. These components are crucial whether …
Availability, Maintainability, Reliability: What's the Difference?
In this blog, we’ll break down reliability in terms of other metrics within reliability engineering: …
